
Computers and Technology, 07.04.2021 18:10 0Me0
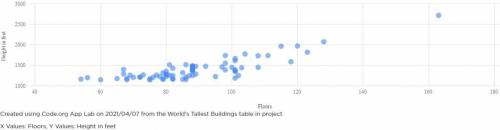
Can someone help me out with these questions the graph is attached below.
What information does your visualization show:
What new insights or decisions can be made based on this visualization:
What are the possible problems with your analysis including potential bias in the dataset or your interpretation:

Answers: 3


Another question on Computers and Technology
Computers and Technology, 22.06.2019 08:40
What are the three parts to physical security standards for various types of army equipment and the risk level
Answers: 2
Computers and Technology, 23.06.2019 22:20
Read “suburban homes construction project” at the end of chapters 8 and 9 (in the textbook) and then develop a wbs (work breakdown structure) in microsoft excel or in microsoft word (using tables)
Answers: 1
Computers and Technology, 24.06.2019 11:30
Why is body language an important factor in a business meeting
Answers: 1
Computers and Technology, 25.06.2019 08:10
Why should the technician watch for signs of contamination in the oil when recovering refrigerant from a system
Answers: 3
You know the right answer?
Can someone help me out with these questions the graph is attached below.
What information does you...
Questions

Social Studies, 07.10.2019 15:50

Health, 07.10.2019 15:50

Mathematics, 07.10.2019 15:50
Mathematics, 07.10.2019 15:50
Mathematics, 07.10.2019 15:50

English, 07.10.2019 15:50
Health, 07.10.2019 15:50
Mathematics, 07.10.2019 15:50
Mathematics, 07.10.2019 15:50

History, 07.10.2019 15:50

Social Studies, 07.10.2019 16:00
Health, 07.10.2019 16:00
History, 07.10.2019 16:00

History, 07.10.2019 16:00


