
Mathematics, 27.06.2019 19:30 10040816
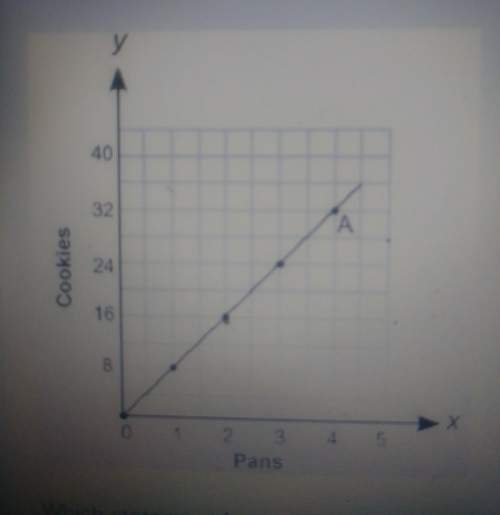
The graph below shows the relationship between the number of cookies made and the number of pans used: which statement best describes point a on the graph? a: four pans make 16 cookies b: four pans make 32 cookies c: one pan makes 16 cookies d: one pan makes 32 cookies

Answers: 2


Another question on Mathematics
Mathematics, 21.06.2019 15:30
Consider the system: y = 3x + 5 y = ax + b what values for a and b make the system inconsistent? what values for a and b make the system consistent and dependent? explain
Answers: 1
Mathematics, 21.06.2019 16:40
According to the number line, what is the distance between points a and b? v ++ + + + + -16 -14 -12 -10 -8 + 6 + 4 + -2 + 0 + 2 + 4 + 6 + 8 + 10 + 12 + 14 + 16 o6 units o 7 units 12 units o 14 units
Answers: 1
Mathematics, 21.06.2019 18:30
Jamie went to home depot.she bought 25 bags of soil that cost $9 per bag.she bought 15 pots at $8 each,and she bought 23 bags of pebbles at $15 each.she used a coupon that gave her $5 off for every 100 dollars she spent.how much did jame pay at the end?
Answers: 1
Mathematics, 21.06.2019 23:40
Full year - williamshow many square inches are in 60 square feet? 5 square inches72 square inches720 square inche8.640 square inches
Answers: 1
You know the right answer?
The graph below shows the relationship between the number of cookies made and the number of pans use...
Questions

Biology, 11.06.2020 00:57
Mathematics, 11.06.2020 00:57

English, 11.06.2020 00:57

Mathematics, 11.06.2020 00:57


