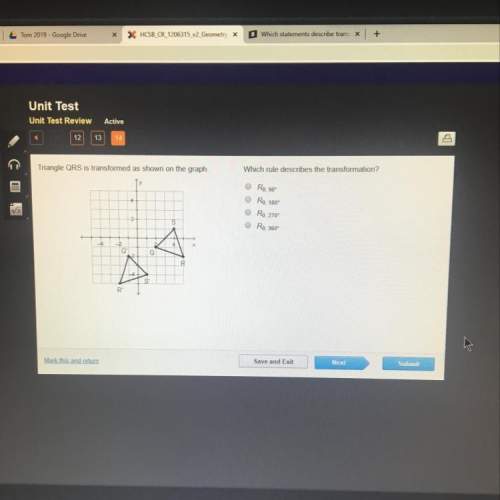
Triangle qrs is transformed as shown on the graph. which rule describes the transformation?
...

Mathematics, 22.06.2019 09:50 khohenfeld0
Triangle qrs is transformed as shown on the graph. which rule describes the transformation?


Answers: 1


Another question on Mathematics

Mathematics, 21.06.2019 12:30
Aschool typically sells 500 yearbooks each year for 50 dollars each. the economic calls does a project and discovers that they can sell 100 more yearbooks for every $5 decrease in price. the revenue for yearbook sales is equal to the number of yearbooks sold times the price of the yearbook. let x represent the number of $5 decrease in price. if the expression that represents the revenue is written in the form r(x)=(500+ax)(50-bx). to maximize profit, what price should the school charge for the yearbooks? what is the possible maximum revenue? if the school attains the maximum revenue, how many yearbooks will they sell?
Answers: 3

Mathematics, 21.06.2019 14:30
The minimum wage in washington has been increasing over the last ten years. years 2000 2001 2002 2003 2004 2005 2006 2007 2008 2009 2010 washington state minimum wage $6.50 $6.72 $6.90 $7.01 $7.16 $7.35 $7.63 $7.93 $8.07 $8.55 $8.55 a) find the linear regression equation for the minimum wage in washington using this data ( x 0 in 2000). round to the thousandths. b) what is the slope? specifically, what does the slope represent in the real world context? c) what is the y-intercept? specifically, what does the y-intercept represent in the real world context? d) write your equation as a function of x. e) if you do not earn a college degree and you are earning minimum wage in 2020, what do you predict you will be earning per hour with the linear regression equation? f) if the trend continues, when will the minimum wage be $15 an hour? 3. why are your answers to #1d and #2a above different? which do you think is more accurate (#1 or #2) and why
Answers: 1

Mathematics, 21.06.2019 16:00
The step function g(x) is defined as shown.what is the range of g(x)? ***answer choices in picture.
Answers: 3

Mathematics, 21.06.2019 16:10
The box plot shows the number of raisins found in sample boxes from brand c and from brand d. each box weighs the same. what could you infer by comparing the range of the data for each brand? a) a box of raisins from either brand has about 28 raisins. b) the number of raisins in boxes from brand c varies more than boxes from brand d. c) the number of raisins in boxes from brand d varies more than boxes from brand c. d) the number of raisins in boxes from either brand varies about the same.
Answers: 2
You know the right answer?
Questions


Mathematics, 21.01.2020 23:31


Social Studies, 21.01.2020 23:31


Mathematics, 21.01.2020 23:31


English, 21.01.2020 23:31

History, 21.01.2020 23:31


