Mathematics, 21.06.2019 16:00 jeff7259
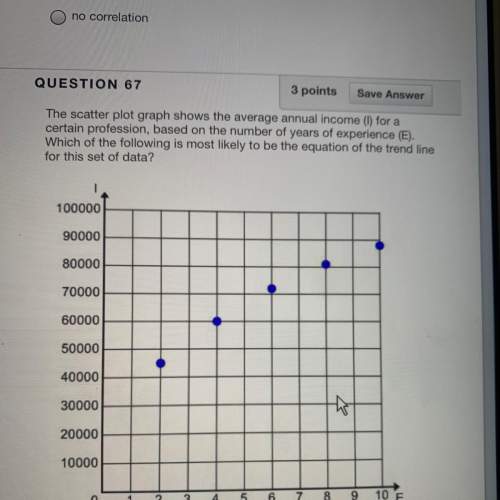
The scatter plot graph shows the average annual income for a certain profession based on the number of years of experience which of the following is most likely to be the equation of the trend line for this set of data? a. i=5350e +37100 b. i=5350e-37100 c. i=5350e d. e=5350e+37100


Answers: 1


Another question on Mathematics

Mathematics, 21.06.2019 12:30
Aconvex octagon has interior angles that measures 73 degrees, 172 degrees, 132 degrees, 59 degrees, 154 degrees, 163 degrees, x degrees, 2x degrees find the value of the missing angles
Answers: 3

Mathematics, 21.06.2019 19:00
Aflower has 26 chromosomes. to create a new flower, how many chromosomes would a sperm cell have? what is this process called? part 2: within a flower cell that has 26 chromosomes, how many chromosomes would a cell that is created within the stem of a flower as it grows, have? what is this process called?
Answers: 1

Mathematics, 21.06.2019 20:00
Afrequency table of grades has five classes (a, b, c, d, f) with frequencies of 3, 13, 14, 5, and 3 respectively. using percentages, what are the relative frequencies of the five classes?
Answers: 3

Mathematics, 21.06.2019 23:00
Using only odd number for numerators write two different subtraction problems that have a difference of 3/4
Answers: 1
You know the right answer?
The scatter plot graph shows the average annual income for a certain profession based on the number...
Questions

Health, 28.03.2020 03:39


Mathematics, 28.03.2020 03:39


Mathematics, 28.03.2020 03:39


Health, 28.03.2020 03:39


