
Mathematics, 17.07.2019 00:40 jorozco3209
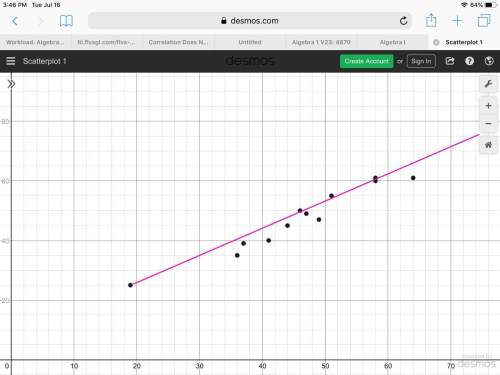
1. which variable did you plot on the x-axis, and which variable did you plot on the y-axis? explain why you assigned the variables in that way.
2. write the equation of the line of best fit using the slope-intercept formula y = mx + b. show all your work, including the points used to determine the slope and how the equation was determined.
3. what does the slope of the line represent within the context of your graph? what does the y-intercept represent?
4. test the residuals of two other points to determine how well the line of best fit models the data.
5. use the line of best fit to you to describe the data correlation.

Answers: 2


Another question on Mathematics
Mathematics, 21.06.2019 20:00
Which type of graph would allow us to quickly see how many students between 100 and 200 students were treated?
Answers: 1
You know the right answer?
1. which variable did you plot on the x-axis, and which variable did you plot on the y-axis? explai...
Questions

Mathematics, 03.02.2020 06:55

History, 03.02.2020 06:55

Mathematics, 03.02.2020 06:55

Chemistry, 03.02.2020 06:55

Arts, 03.02.2020 06:55

Biology, 03.02.2020 06:55
Mathematics, 03.02.2020 06:55

Business, 03.02.2020 06:55
Chemistry, 03.02.2020 06:55
History, 03.02.2020 06:55


