
Mathematics, 26.10.2019 01:43 riaahroo2378
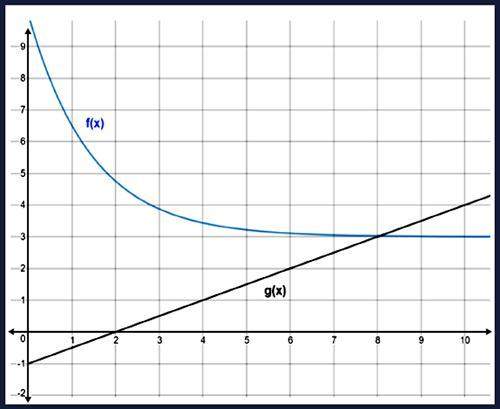
Two scientists are running experiments on the same type of bacteria in different control groups. the results are shown in the graph using the functions f(x) and g(x):
which statement best describes the graph of f(x) and g(x)?
the graph of f(x) will eventually exceed the graph of g(x).
the graph of g(x) will eventually exceed the graph of f(x).
the graphs will both have their y-intercept equal to −1.
the graphs will both have their y-intercept equal to 8.

Answers: 1


Another question on Mathematics
Mathematics, 21.06.2019 14:30
Describe in detail how you would construct a 95% confidence interval for a set of 30 data points whose mean is 20 and population standard deviation is 3. be sure to show that you know the formula and how to plug into it. also, clearly state the margin of error.
Answers: 3
Mathematics, 21.06.2019 20:30
Solve each quadratic equation by factoring and using the zero product property. x^2 - 8x + 30 = 3x
Answers: 2
Mathematics, 21.06.2019 22:30
Which statements are true about additional information for proving that the triangles are congruent check all that apply
Answers: 1
You know the right answer?
Two scientists are running experiments on the same type of bacteria in different control groups. the...
Questions

English, 07.10.2019 09:20
English, 07.10.2019 09:20


Mathematics, 07.10.2019 09:20
Mathematics, 07.10.2019 09:20

Physics, 07.10.2019 09:20

History, 07.10.2019 09:20
Mathematics, 07.10.2019 09:20


