
Mathematics, 07.12.2019 20:31 cbrewer37
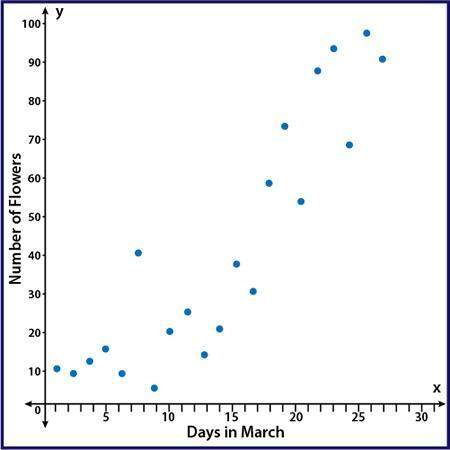
The scatter plot shows the number of flowers that have bloomed in the garden during the month of march: a scatter plot with points showing an upward trend with points that are moderately spread out from a line of best fit. the y axis is labeled number of flowers and the x axis is labeled days in march part a: using computer software, a correlation coefficient of r = 0.98 was calculated. based on the scatter plot, is that an accurate value for this data? why or why not? (5 points) part b: instead of comparing the number of flowers and the day in march, write a scenario that would be a causal relationship for flowers in a garden. (5 points

Answers: 1


Another question on Mathematics
Mathematics, 21.06.2019 16:50
Which is a true statement comparing the graphs of x^2/6^2-y^2/8^2 = 1 and x^2/8^2-y^2/6^2 the foci of both graphs are the same points. the lengths of both transverse axes are the same. the directrices of = 1 are horizontal while the directrices of = 1 are vertical. the vertices of = 1 are on the y-axis while the vertices of = 1 are on the x-axis.
Answers: 2
Mathematics, 21.06.2019 20:30
Find the value of x for which line a is parallel to line b
Answers: 1
Mathematics, 21.06.2019 22:30
Amachine that produces a special type of transistor (a component of computers) has a 2% defective rate. the production is considered a random process where each transistor is independent of the others. (a) what is the probability that the 10th transistor produced is the first with a defect? (b) what is the probability that the machine produces no defective transistors in a batch of 100? (c) on average, how many transistors would you expect to be produced before the first with a defect? what is the standard deviation? (d) another machine that also produces transistors has a 5% defective rate where each transistor is produced independent of the others. on average how many transistors would you expect to be produced with this machine before the first with a defect? what is the standard deviation? (e) based on your answers to parts (c) and (d), how does increasing the probability of an event a↵ect the mean and standard deviation of the wait time until success?
Answers: 3
Mathematics, 22.06.2019 01:00
Urgent? will give brainliest to the first correct answer what is the area of the figure?
Answers: 3
You know the right answer?
The scatter plot shows the number of flowers that have bloomed in the garden during the month of mar...
Questions

Health, 23.06.2020 10:57

Business, 23.06.2020 10:57
Business, 23.06.2020 10:57
Business, 23.06.2020 10:57
Business, 23.06.2020 10:57

Mathematics, 23.06.2020 10:57

Mathematics, 23.06.2020 10:57

Mathematics, 23.06.2020 10:57
Mathematics, 23.06.2020 10:57
Business, 23.06.2020 10:57
Business, 23.06.2020 10:57
Mathematics, 23.06.2020 10:57
Mathematics, 23.06.2020 10:57
Business, 23.06.2020 10:57


