Mathematics, 14.02.2020 21:16 googoo4
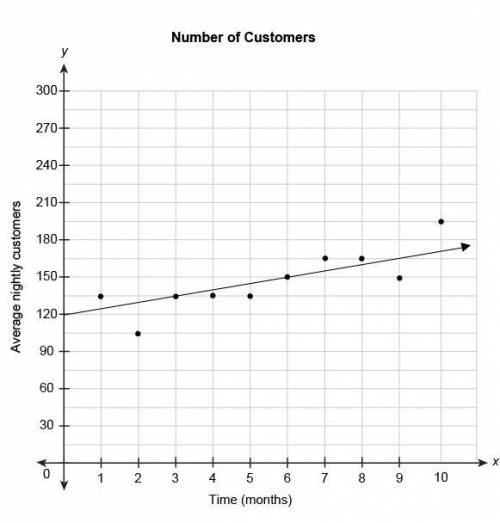
The scatter plot shows the relationship between the average number of nightly customers and the number of months since a restaurant opened. The equation represents the linear model for this data.
y = 5x + 120
What does the number 5 in the equation mean in this context?
The average number of customers per night increased by 5 each month.
For every 5 months the restaurant has been open, there are 120 more customers per night.
There were 5 customers per night when the restaurant opened.
The restaurant has been open for 5 months.
There were 5 customers per month after the restaurant was open 120 months.
A graph measuring months since opening in relation to average nightly customers. A line indicates that customers increase as months increase


Answers: 1


Another question on Mathematics

Mathematics, 21.06.2019 16:00
An appliance store sells a washer-dryer combination for $1800. if the washer costs $300 more than the dryer, find the cost for each appliance.
Answers: 3

Mathematics, 21.06.2019 22:00
Out of 50 students surveyed, 16 have a dog. based on these results, predict how many of the 280 students in the school have a dog.
Answers: 2


You know the right answer?
The scatter plot shows the relationship between the average number of nightly customers and the numb...
Questions

History, 28.01.2020 18:09


Mathematics, 28.01.2020 18:09


Mathematics, 28.01.2020 18:09

Mathematics, 28.01.2020 18:09

History, 28.01.2020 18:09

Spanish, 28.01.2020 18:09

English, 28.01.2020 18:09

Computers and Technology, 28.01.2020 18:09

Chemistry, 28.01.2020 18:09


English, 28.01.2020 18:09


English, 28.01.2020 18:09


Business, 28.01.2020 18:09

History, 28.01.2020 18:09

Mathematics, 28.01.2020 18:09


