Mathematics, 26.02.2020 05:53 10121545
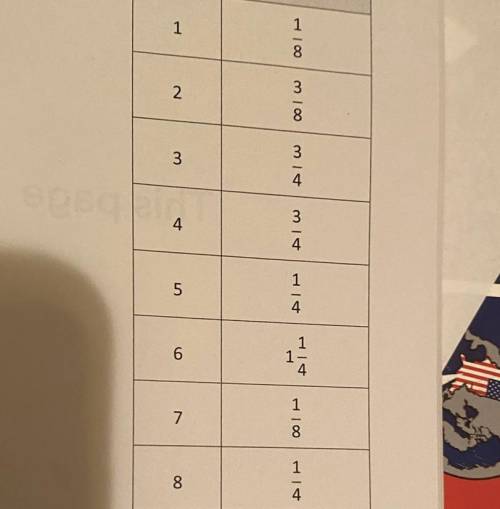
A meteorologist set up rain gauges locations around a city and recorded the rainfall amounts in the table below use the date in the table to create a line plot using 1/8 inches
(The table is up there)
a) which location received the most rainfall?
B) which location received the least rainfall?
C) which rainfall measurement was the most frequent?
D) what is the total rainfall in inches?
•answer these on paper
•put the answer only! Use the comments if u need to say something
•organized
Thanks! Make sure your answer is helpful and correct for others!


Answers: 1


Another question on Mathematics

Mathematics, 21.06.2019 14:00
What are the critical values that correspond to a 95% confidence level and a sample size of 93? a. 65.647, 118.136 b. 59.196, 128.299 c. 57.143, 106.629 d. 69.196, 113.145
Answers: 3

Mathematics, 21.06.2019 18:30
What is the prime factorization of 23 ?me with this question
Answers: 1

Mathematics, 21.06.2019 21:30
About 9% of th population is hopelessly romantic. if 2 people are randomly selected from the population, what is the probability that at least 1 person is hopelessly romantic?
Answers: 1

Mathematics, 21.06.2019 22:30
Whit h equation best represents this situation the number 98 increased by an unknown number equal to 120
Answers: 1
You know the right answer?
A meteorologist set up rain gauges locations around a city and recorded the rainfall amounts in the...
Questions


Mathematics, 15.06.2021 09:50


Mathematics, 15.06.2021 09:50


Social Studies, 15.06.2021 09:50


Geography, 15.06.2021 09:50

Engineering, 15.06.2021 09:50


Mathematics, 15.06.2021 09:50


Chemistry, 15.06.2021 09:50


