1.
(06.01 MC)
The scatter plot shows the relationship between the test scores of a...

Mathematics, 20.03.2020 01:40 nett4386
1.
(06.01 MC)
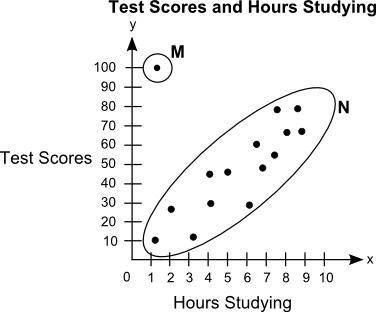
The scatter plot shows the relationship between the test scores of a group of students and the number of hours they study in a week:
On a grid, Label Hours Studying on x axis and Test Scores on y axis. The title of the graph is Test Scores and Hours Studying. The scale on the x axis shows the numbers from 0 to 10 at increments of 1, and the scale on the y axis shows numbers from 0 to 100 at increments of 10. Dots are made at the ordered pairs 1.1, 10 and 2, 25 and 3.1, 10.1 and 4, 30 and 4, 45 and 5, 45 and 6, 25 and 6.5, 60 and 7, 45 and 7.5, 50 and 7.5, 75 and 8, 60 and 8.5, 75 and 9, 60. The ordered pair 1, 100 is circled and labeled as M. All the other points are put in an oval and labeled as N.
Part A: What is the group of points labeled N called? What is the point labeled M called? Give a possible reason for the presence of point M. (5 points)
Part B: Describe the association between students' test scores and the number of hours they study. (5 points)

Answers: 3


Another question on Mathematics
Mathematics, 21.06.2019 14:30
What is the volume of a rectangular prism if the length is 10.4 mm the width is 5 mm in the height is 8 mm
Answers: 1
Mathematics, 21.06.2019 22:50
If set d is not the empty set but is a subset of set e, then which of the following is true? d ∩ e = d d ∩ e = e d ∩ e = ∅
Answers: 1
Mathematics, 22.06.2019 00:30
You eat $0.85 for every cup of hot chocolate you sell. how many cups do you need to sell to earn $55.25
Answers: 2
You know the right answer?
Questions

History, 28.02.2021 14:00

Mathematics, 28.02.2021 14:00

Advanced Placement (AP), 28.02.2021 14:00

Mathematics, 28.02.2021 14:00

English, 28.02.2021 14:00

Mathematics, 28.02.2021 14:00

Health, 28.02.2021 14:00

Mathematics, 28.02.2021 14:00
Chemistry, 28.02.2021 14:00


