
Mathematics, 31.03.2020 00:27 Faizalcell2120
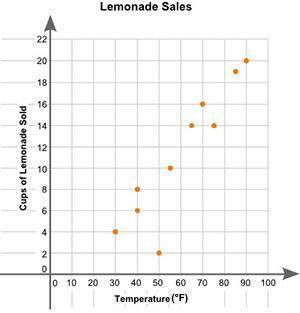
Eric plotted the graph below to show the relationship between the temperature of his city and the number of cups of lemonade he sold daily.
Part A: Describe the relationship between the temperature of the city and the number of cups of lemonade sold.
Part B: Describe how you can make the line of best fit. Write the approximate slope and y-intercept of the line of best fit. Show your work, including the points that you use to calculate the slope and y-intercept

Answers: 2


Another question on Mathematics
Mathematics, 21.06.2019 17:30
Using the side-splitter theorem, daniel wrote a proportion for the segment formed by luke segment de. what is ec?
Answers: 3
Mathematics, 21.06.2019 18:30
Savannah is painting a striped background for a mural on a wall that is 1515 yards long. she wants a total of 9696 stripes that are all the same width. which calculation should savannah use to decide how wide to make each stripe?
Answers: 3
Mathematics, 21.06.2019 20:00
Segment an is an altitude of right δabc with a right angle at a. if ab = 2, squared 5 in and nc = 1 in, find bn, an, ac.
Answers: 2
You know the right answer?
Eric plotted the graph below to show the relationship between the temperature of his city and the nu...
Questions

English, 30.08.2019 13:00

Mathematics, 30.08.2019 13:00
Mathematics, 30.08.2019 13:00


Mathematics, 30.08.2019 13:00
Mathematics, 30.08.2019 13:00
Mathematics, 30.08.2019 13:00
Social Studies, 30.08.2019 13:00


