Mathematics, 31.03.2020 18:09 talyku7131
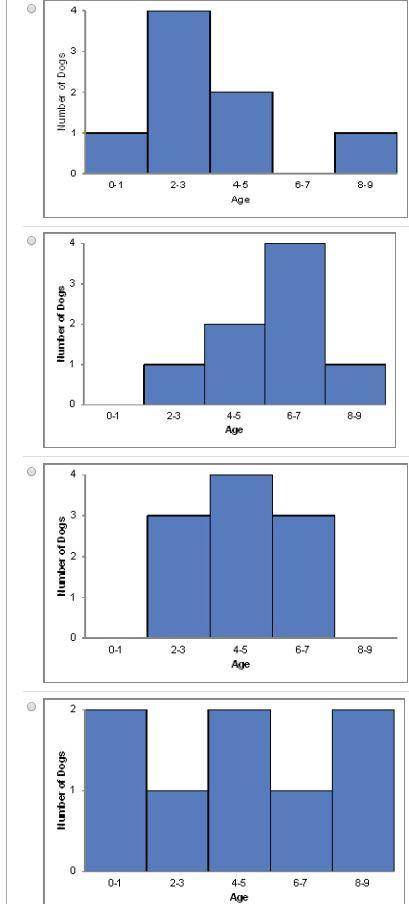
The histograms below show the ages of dogs at four different shelters. For which set of data is the mean most likely less than the median?
(If you're having trouble seeing, X is the Age, Y is the amount of Dogs.)
I know it's not B, because I took this test before, and it said that was incorrect.


Answers: 1


Another question on Mathematics


Mathematics, 22.06.2019 06:00
Kaley cuts half of a loaf of bread into 4 equal parts. what fraction of the whole loaf does each of the 4 parts represent?
Answers: 2

Mathematics, 22.06.2019 08:30
What percentage of the sales of coupes were negotiated by lydia
Answers: 3
You know the right answer?
The histograms below show the ages of dogs at four different shelters. For which set of data is the...
Questions


Biology, 13.03.2021 01:40


Mathematics, 13.03.2021 01:40


Mathematics, 13.03.2021 01:40

Mathematics, 13.03.2021 01:40

Mathematics, 13.03.2021 01:40

History, 13.03.2021 01:40

Computers and Technology, 13.03.2021 01:40

Chemistry, 13.03.2021 01:40


Mathematics, 13.03.2021 01:40


History, 13.03.2021 01:40

Chemistry, 13.03.2021 01:40

History, 13.03.2021 01:40


