Question 1 of 10
2 Points
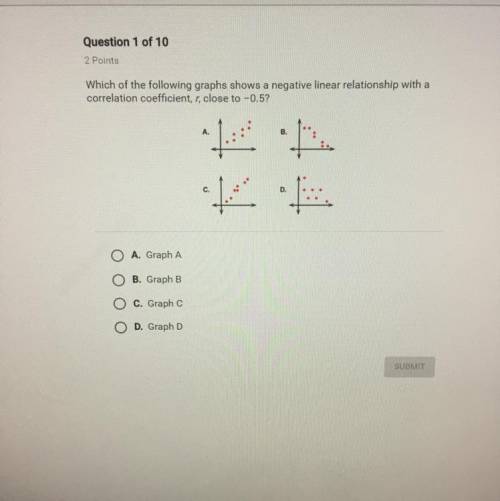
Which of the following graphs shows a negative linear relation...

Mathematics, 01.04.2020 17:44 Donlito8070
Question 1 of 10
2 Points
Which of the following graphs shows a negative linear relationship with a
correlation coefficient, r, close to -0.5?
A. Graph A
B. Graph B
C. Graph
D. Graph D


Answers: 1


Another question on Mathematics

Mathematics, 21.06.2019 16:30
Antonio made a scale model of a building. the model's scale is 1 inch to 235 feet and its height is 3.5 inches. what is the exact height of the actual building? enter your answer in the box.
Answers: 1

Mathematics, 21.06.2019 16:30
You are updating your garage and the only thing left to paint is your garage day. you're only going to paint the slide that faces the street. the garage door is 9 fert 8inches tall and 120 inches wide. you need to know the surface area of the side of the garage door to determine how much paint to buy. the hardware store sells paint by how much covers a square foot. what is the surface area you should report to the hardware store what is the answer
Answers: 3

Mathematics, 21.06.2019 16:50
For the equations below which statement is true ? -2x=14 6x=-42
Answers: 1

Mathematics, 21.06.2019 19:40
Ascatter plot with a trend line is shown below. which equation best represents the given data? y = x + 2 y = x + 5 y = 2x + 5
Answers: 1
You know the right answer?
Questions

History, 17.03.2020 20:25

History, 17.03.2020 20:25


Mathematics, 17.03.2020 20:25

Mathematics, 17.03.2020 20:25


Mathematics, 17.03.2020 20:25


Mathematics, 17.03.2020 20:25

Mathematics, 17.03.2020 20:25


History, 17.03.2020 20:25


