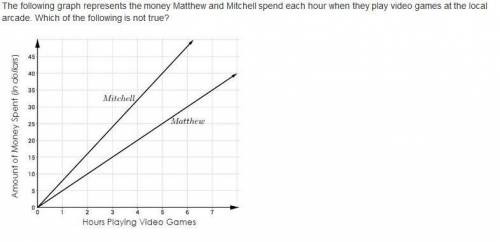
A. Matthew is spending $5 per hour.
B. Mitchell is spending less money per hour than Matthew.<...

Mathematics, 05.04.2020 21:09 zoolo1
A. Matthew is spending $5 per hour.
B. Mitchell is spending less money per hour than Matthew.
C. Mitchell is spending his money at a faster rate than Matthew.
D. The rate of change represents the amount of money spent playing video games per hour.

Answers: 1


Another question on Mathematics
Mathematics, 21.06.2019 22:30
Your best friend told you that last week scientists disco y that las vegas is responsible for abrupt climate changes. which do you think is best way to research that recent discovery? an encyclopedia usgs internet site a book in the library your best friend’s parents for your ! ❤️
Answers: 2
Mathematics, 21.06.2019 23:00
Each of the following data sets has a mean of x = 10. (i) 8 9 10 11 12 (ii) 7 9 10 11 13 (iii) 7 8 10 12 13 (a) without doing any computations, order the data sets according to increasing value of standard deviations. (i), (iii), (ii) (ii), (i), (iii) (iii), (i), (ii) (iii), (ii), (i) (i), (ii), (iii) (ii), (iii), (i) (b) why do you expect the difference in standard deviations between data sets (i) and (ii) to be greater than the difference in standard deviations between data sets (ii) and (iii)? hint: consider how much the data in the respective sets differ from the mean. the data change between data sets (i) and (ii) increased the squared difference îł(x - x)2 by more than data sets (ii) and (iii). the data change between data sets (ii) and (iii) increased the squared difference îł(x - x)2 by more than data sets (i) and (ii). the data change between data sets (i) and (ii) decreased the squared difference îł(x - x)2 by more than data sets (ii) and (iii). none of the above
Answers: 2
Mathematics, 21.06.2019 23:30
Peyton's field hockey team wins 4 games out of every 7 games played. her team lost 9 games. how many games did peyton's team play?
Answers: 2
Mathematics, 22.06.2019 04:20
Dana kicks a soccer ball. the table shows the height of the soccer ball with respect to the time, in seconds, after the ball was kicked.time | height(seconds) | (feet) ~~~~~~~~~~~~~~~0.5 211 341.5 392 362.5 253 6which graph best displays the relationship shown in the table? (i just need confirmation that its c)
Answers: 2
You know the right answer?
Questions

Computers and Technology, 18.10.2021 03:20
Mathematics, 18.10.2021 03:20

History, 18.10.2021 03:20

English, 18.10.2021 03:20
Mathematics, 18.10.2021 03:20

Biology, 18.10.2021 03:20

Mathematics, 18.10.2021 03:20
Mathematics, 18.10.2021 03:20
Mathematics, 18.10.2021 03:20
Mathematics, 18.10.2021 03:20

Physics, 18.10.2021 03:20
Mathematics, 18.10.2021 03:20


