Mathematics, 14.04.2020 21:20 sbu15
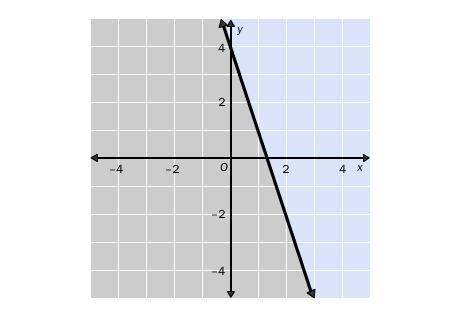
Write the linear inequality shown in the graph. The gray area represents the shaded region.
y ≤ –3x + 4
y ≥ –3x + 4
y ≥ –3x – 4
y ≤ –3x – 4


Answers: 2


Another question on Mathematics

Mathematics, 21.06.2019 16:40
Identify an equation in point slope form for the line perpendicular to y=3x+5 that passes through (4,-1)
Answers: 2

Mathematics, 21.06.2019 17:30
8000 + 8800 + 8000 + 8 million + 80 trillion + another a katrillion equals
Answers: 1

Mathematics, 21.06.2019 19:30
Order the measurements from the least to the greatest. 2,720 ml , 24.91 l , 0.0268 kl
Answers: 1

Mathematics, 21.06.2019 20:10
Complete the solution of the equation. find the value of y when x equals -5. -4x - 8y = -52
Answers: 2
You know the right answer?
Write the linear inequality shown in the graph. The gray area represents the shaded region.
Questions

Social Studies, 18.09.2019 22:40

History, 18.09.2019 22:40


Chemistry, 18.09.2019 22:40


Biology, 18.09.2019 22:40


Biology, 18.09.2019 22:40


Mathematics, 18.09.2019 22:40


Mathematics, 18.09.2019 22:40


Biology, 18.09.2019 22:40

Mathematics, 18.09.2019 22:40


