
Mathematics, 14.04.2020 23:18 angelreji386
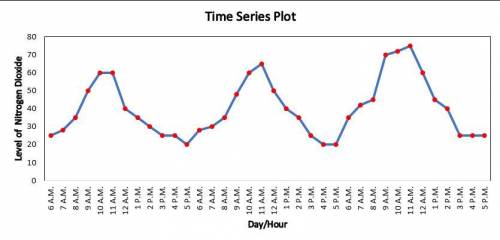
Air pollution control specialists in southern California monitor the amount of ozone, carbon dioxide, and nitrogen dioxide in the air on an hourly basis. The hourly time series data exhibit seasonality, with the levels of pollutants showing patterns that vary over the hours in the day. On July 15, 16, and 17, the following levels of nitrogen dioxide were observed for the 12 hours from 6:00 A. M. to 6:00 P. M.
July15 25 28 35 50 60 60 40 35 30 25 25 20
July16 28 30 35 48 60 65 50 40 35 25 20 20
July17 35 42 45 70 72 75 60 45 40 25 25 25
(a) Construct a time series plot. What type of pattern exists in the data?

Answers: 3


Another question on Mathematics
Mathematics, 21.06.2019 18:30
Can someone check if i did this right since i really want to make sure it’s correct. if you do you so much
Answers: 1
Mathematics, 21.06.2019 18:30
Analyze the graph of the cube root function shown on the right to determine the transformations of the parent function. then, determine the values of a, h, and k in the general equation.
Answers: 1
Mathematics, 21.06.2019 19:00
What numbers are included in the set of integers? what numbers are not included?
Answers: 2
Mathematics, 21.06.2019 19:30
Evaluate 3(a + b + c)squared for a = 2, b = 3, and c = 4. a. 54 b. 243 c.729 add solution .
Answers: 1
You know the right answer?
Air pollution control specialists in southern California monitor the amount of ozone, carbon dioxide...
Questions
Mathematics, 15.02.2020 11:54

English, 15.02.2020 11:54

Social Studies, 15.02.2020 11:55

History, 15.02.2020 12:00
Mathematics, 15.02.2020 12:02
Mathematics, 15.02.2020 12:09

Mathematics, 15.02.2020 12:15

Mathematics, 15.02.2020 12:18
English, 15.02.2020 12:18

Mathematics, 15.02.2020 12:20
Mathematics, 15.02.2020 12:23


