Mathematics, 15.04.2020 15:36 fordkenae
A data set has a lower quartile of 3 and an interquartile range of 5. Which box plot could represent this data set?
(a) A box-and-whisker plot. The number line goes from 0 to 25. The whiskers range from 2 to 15, and the box ranges from 3 to 8. A line divides the box at 6.
(b) A box-and-whisker plot. The number line goes from 0 to 25. The whiskers range from 4 to 16, and the box ranges from 4 to 11. A line divides the box at 9.
(c) A box-and-whisker plot. The number line goes from 0 to 25. The whiskers range from 2 to 15, and the box ranges from 3 to 10. A line divides the box at 8.
(d) A box-and-whisker plot. The number line goes from 0 to 25. The whiskers range from 3 to 16, and the box ranges from 4 to 9. A line divides the box at 7.

Answers: 2


Another question on Mathematics

Mathematics, 20.06.2019 18:04
Point e(−5, 3) and point d(−4, −3) are located on the grid. which measurement is closest to the distance between point e and point d in units? a) 6.1 units b) 6.3 units c) 6.5 units d) 6.7 units
Answers: 2

Mathematics, 21.06.2019 16:00
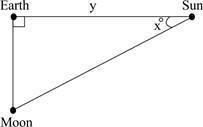
Given right triangle xyz, which correctly describes the locations of the sides in relation to
Answers: 1

Mathematics, 21.06.2019 18:00
Someone this asap for a group of students attends a basketball game. * the group buys x hot dogs at the concession stand for $2 each. * the group buys y drinks at the concession stand for $3 each. the group buys 29 items at the concession stand for a total of $70. how many hot dogs did the group buy?
Answers: 1

Mathematics, 21.06.2019 20:30
Joe has some money in his bank account he deposits 45$ write an expression that represents the amount of money in joe's account
Answers: 2
You know the right answer?
A data set has a lower quartile of 3 and an interquartile range of 5. Which box plot could represent...
Questions


English, 16.01.2020 20:31


Mathematics, 16.01.2020 20:31


History, 16.01.2020 20:31

Business, 16.01.2020 20:31


Mathematics, 16.01.2020 20:31


