ITS NOT (D)
Cable Company Rates
45+
Their Cost
Cost (dollars)
Our Cost...

Mathematics, 24.04.2020 08:02 Kylabayor
ITS NOT (D)
Cable Company Rates
45+
Their Cost
Cost (dollars)
Our Cost
3
8
9
4 5 6 7
Time (days)
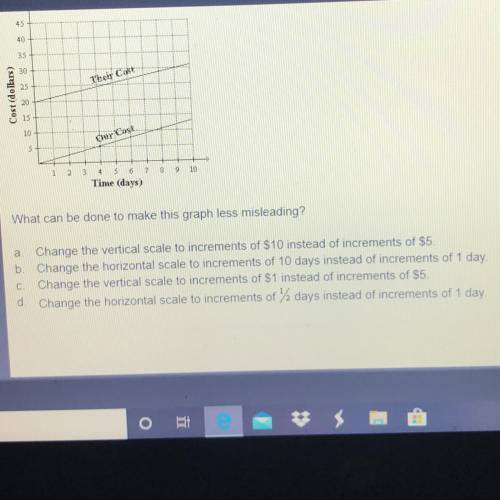
What can be done to make this graph less misleading?
a. Change the vertical scale to increments of $10 instead of increments of $5.
b. Change the horizontal scale to increments of 10 days instead of increments of 1 day
C. Change the vertical scale to increments of S1 instead of increments of $5.
d. Change the horizontal scale to increments of days instead of increments of 1 day
Submitted


Answers: 1


Another question on Mathematics

Mathematics, 21.06.2019 15:40
Each of the walls of a room with square dimensions has been built with two pieces of sheetrock, a smaller one and a larger one. the length of all the smaller ones is the same and is stored in the variable small. similarly, the length of all the larger ones is the same and is stored in the variable large. write a single expression whose value is the total area of this room. do not use any method invocations.
Answers: 1

Mathematics, 21.06.2019 16:20
The lengths of nails produced in a factory are normally distributed with a mean of 4.91 centimeters and a standard deviation of 0.05 centimeters. find the two lengths that separate the top 4% and the bottom 4%. these lengths could serve as limits used to identify which nails should be rejected. round your answer to the nearest hundredth, if necessary.
Answers: 3

Mathematics, 22.06.2019 02:00
1. the manager of collins import autos believes the number of cars sold in a day (q) depends on two factors: (1) the number of hours the dealership is open (h) and (2) the number of salespersons working that day (s). after collecting data for two months (53 days), the manager estimates the following log-linear model: q 4 equation 1 a. explain, how to transform the log-linear model into linear form that can be estimated using multiple regression analysis. the computer output for the multiple regression analysis is shown below: q4 table b. how do you interpret coefficients b and c? if the dealership increases the number of salespersons by 20%, what will be the percentage increase in daily sales? c. test the overall model for statistical significance at the 5% significance level. d. what percent of the total variation in daily auto sales is explained by this equation? what could you suggest to increase this percentage? e. test the intercept for statistical significance at the 5% level of significance. if h and s both equal 0, are sales expected to be 0? explain why or why not? f. test the estimated coefficient b for statistical significance. if the dealership decreases its hours of operation by 10%, what is the expected impact on daily sales?
Answers: 2

Mathematics, 22.06.2019 03:30
Find the solution set for this equation: t^2+7t=0 separate the two values with a comma.
Answers: 2
You know the right answer?
Questions

English, 11.10.2019 01:00

Social Studies, 11.10.2019 01:00

Mathematics, 11.10.2019 01:00

English, 11.10.2019 01:00

Mathematics, 11.10.2019 01:00


Physics, 11.10.2019 01:00

Social Studies, 11.10.2019 01:00


Arts, 11.10.2019 01:00


Advanced Placement (AP), 11.10.2019 01:00

Biology, 11.10.2019 01:00

English, 11.10.2019 01:00

Social Studies, 11.10.2019 01:00

Health, 11.10.2019 01:00


Mathematics, 11.10.2019 01:00


