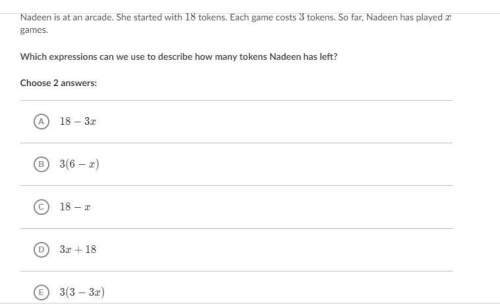
How would you describe the difference between the graphs of f(x) = x2 +4 and
9(y) = y2 + 4 ?...

Mathematics, 04.05.2020 23:56 mia2286
How would you describe the difference between the graphs of f(x) = x2 +4 and
9(y) = y2 + 4 ?

Answers: 2


Another question on Mathematics

Mathematics, 21.06.2019 19:00
Amodel rocket is launched from a roof into a large field. the path of the rocket can be modeled by the equation y = -0.04x^2 + 8.6x + 4.8, where x is the horizontal distance, in meters, from the starting point on the roof and y is the height, in meters, of the rocket above the ground. how far horizontally from its starting point will the rocket land? a. 0.56 m b. 215.56 m c. 431.11 m d. 215.74 m
Answers: 1

Mathematics, 21.06.2019 23:30
Atruck can be rented from company a $50 a day plus $0.60 per mile. company b charges $20 a day plus $0.80 per mile to rent the same truck. find the number of miles in a day at which the rental costs for company a and company b are the same
Answers: 1

Mathematics, 22.06.2019 01:00
Leslie started last week with $1200 in her checking account. during the week, she wrote the checks below. trans typ./ check no. date description of transaction payment/ debit deposit/ credit (+) balance 1,200 00 324 10/6 miller's food market 45.87 45 87 groceries 1,154 13 325 10/7 cyber center computer outlet 218.59 218 59 monitor 935 54 326 10/9 sandy's beauty salon 30.00 30 00 haircut and styling 900 59 deposit 10/10 paycheck 621.33 621 33 1,621 92 evaluate leslie's check register. a. leslie did a good job. everything is correct. b. the final balance is wrong; she did not add everything correctly. c. leslie should have written debit instead of deposit for the transaction type. d. leslie switched the debit and credit columns.
Answers: 2

Mathematics, 22.06.2019 01:00
The weight of 46 new patients of a clinic from the year 2018 are recorded and listed below. construct a frequency distribution, using 7 classes. then, draw a histogram, a frequency polygon, and an ogive for the data, using the relative information from the frequency table for each of the graphs. describe the shape of the histogram. data set: 130 192 145 97 100 122 210 132 107 95 210 128 193 208 118 196 130 178 187 240 90 126 98 194 115 212 110 225 187 133 220 218 110 104 201 120 183 124 261 270 108 160 203 210 191 180 1) complete the frequency distribution table below (add as many rows as needed): - class limits - class boundaries - midpoint - frequency - cumulative frequency 2) histogram 3) frequency polygon 4) ogive
Answers: 1
You know the right answer?
Questions

Spanish, 23.06.2019 22:30

Mathematics, 23.06.2019 22:30


Mathematics, 23.06.2019 22:30


Mathematics, 23.06.2019 22:30

Chemistry, 23.06.2019 22:30

Mathematics, 23.06.2019 22:30


Geography, 23.06.2019 22:30


Geography, 23.06.2019 22:30

Mathematics, 23.06.2019 22:30


Biology, 23.06.2019 22:30


