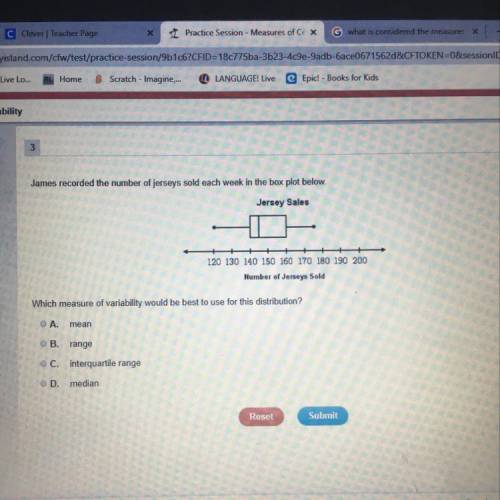
James recorded the number of jerseys sold each week in the box plot below.
Jersey Sales
...

Mathematics, 22.05.2020 07:04 mathiscool51
James recorded the number of jerseys sold each week in the box plot below.
Jersey Sales
120 130 140 150 160 170 180 190 200
Number of Jerseys Sold
Which measure of variability would be best to use for this distribution?
O A.
mean
B. range
C. interquartile range
OD. median


Answers: 1


Another question on Mathematics

Mathematics, 21.06.2019 13:30
34 cup. a serving of vegetable soup is 23 cup. the restaurant sold 20 servings of chicken noodle soup and 18 servings of vegetable soup. how many more cups of chicken noodle soup did they sell than cups of vegetable soup?
Answers: 2

Mathematics, 21.06.2019 16:20
Two lines parallel to the same plane are parallel to eachother
Answers: 1

Mathematics, 21.06.2019 19:30
Louis wants to carpet the rectangular floor of his basement.the basement has an area of 864 square feet.the width of the basement is 2/3 it's length. what is the length of louis's basement
Answers: 1

Mathematics, 21.06.2019 20:30
Laura read 1/8 of a comic book in 2 days. she reads the same number of pages every day. what part of the book does she read in a week
Answers: 1
You know the right answer?
Questions

Mathematics, 30.05.2020 20:01


Computers and Technology, 30.05.2020 20:01


Mathematics, 30.05.2020 20:01


Mathematics, 30.05.2020 20:01


