Mathematics, 13.06.2020 03:57 alainacorkell2087
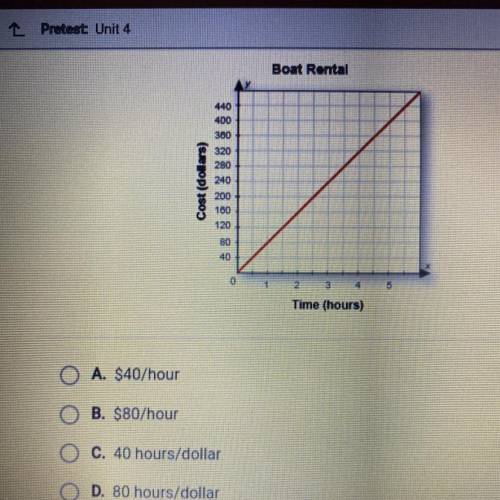
The graph shows how the length of time a boat is rented is related to the rental cost. What is the rate of change shown in the graph?


Answers: 3


Another question on Mathematics

Mathematics, 21.06.2019 15:50
If n stands for number sold and c stands for cost per item, in which column would you use the formula: ? a. column d c. column f b. column e d. column g
Answers: 1

Mathematics, 21.06.2019 20:30
Create a question with this scenario you could ask that could be answered only by graphing or using logarithm. david estimated he had about 20 fish in his pond. a year later, there were about 1.5 times as many fish. the year after that, the number of fish increased by a factor of 1.5 again. the number of fish is modeled by f(x)=20(1.5)^x.
Answers: 1

Mathematics, 21.06.2019 22:00
Billie holiday sells children's clothing for sara vaughn's toddler shop. baby blankets sell for $29.99 after a markup rate based on cost of 109%. find the cost and the markup.
Answers: 2

Mathematics, 22.06.2019 01:30
The actual length of side y is 22 cm. use the scale drawing to find the actual length of side x. a) 15.2 cm b) 17.1 cm c) 18.0 cm d) 28.3 cm
Answers: 1
You know the right answer?
The graph shows how the length of time a boat is rented is related to the
rental cost. What is the...
Questions


Mathematics, 21.10.2019 23:30

Geography, 21.10.2019 23:30


History, 21.10.2019 23:30


Health, 21.10.2019 23:30

History, 21.10.2019 23:30

Business, 21.10.2019 23:30

Social Studies, 21.10.2019 23:30

Mathematics, 21.10.2019 23:30


Health, 21.10.2019 23:30


