Mathematics, 04.07.2020 07:01 destinyycooper
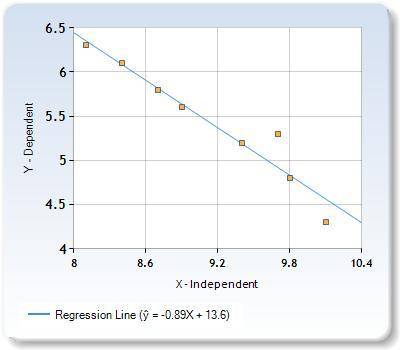
PLEASE HELP! Use a graphing calculator to find an equation of the line of best fit for the data in the table. Round the slope and y-intercept to the nearest tenth. Then Identify and interpret the correlation coefficient.
X- 10.1 9.8 9.7 9.4 8.9 8.7 8.4 8.1
Y- 4.3 4.8 5.3 5.2 5.6 5.8 6.1 6.3
The equation of the line of best fit is y=
To the nearest thousandth, the correlation coefficient is r=

Answers: 1


Another question on Mathematics

Mathematics, 21.06.2019 15:00
Suppose a ball is dropped fromca height of 6ft. it bounces back up but time it bounces, it reaches only 7/10 of its pervious height. what is the total of each height that the ball reaches after 5 bounces
Answers: 1

Mathematics, 21.06.2019 22:00
If the altitude is drawn to the hypotenuse of a right triangle, then the two triangles formed are similar to the original triangle and to each other. which set of triangles shows the similar triangles created by the altitude in the diagram?
Answers: 3

Mathematics, 21.06.2019 22:30
Solve: 25 points find the fifth term of an increasing geometric progression if the first term is equal to 7−3 √5 and each term (starting with the second) is equal to the difference of the term following it and the term preceding it.
Answers: 1

Mathematics, 22.06.2019 01:30
Find the vertex for the parabola given by the function ƒ(x) = −3x2 − 6x.
Answers: 2
You know the right answer?
PLEASE HELP! Use a graphing calculator to find an equation of the line of best fit for the data in t...
Questions

Mathematics, 22.09.2020 01:01

Mathematics, 22.09.2020 01:01

English, 22.09.2020 01:01

Mathematics, 22.09.2020 01:01

Mathematics, 22.09.2020 01:01

Mathematics, 22.09.2020 01:01

Mathematics, 22.09.2020 01:01

Chemistry, 22.09.2020 01:01


Mathematics, 22.09.2020 01:01

Business, 22.09.2020 01:01


English, 22.09.2020 01:01


Mathematics, 22.09.2020 01:01


Mathematics, 22.09.2020 01:01


![\begin{array}{|c|cc|} \mathbf{Column \ 1}&&\mathbf{Column \ 2}\\10.1&&4.3\\9.8&&4.8\\9.7&&5.3\\9.4&&5.2\\8.9&&5.6\\8.7&&5.8\\8.4&&6.1\\8.1&&6.3\end{array}\right]](/tpl/images/0701/0726/56e05.png)


