
Mathematics, 15.07.2020 02:01 hellokitty1647
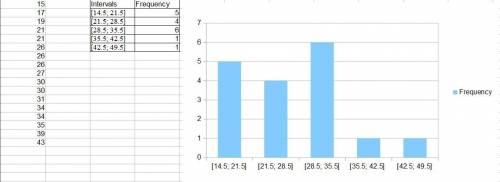
Below are the times (in days) it takes for a sample of 17 customers from Andrew's computer store to pay their invoices.
19, 15, 43, 39, 35, 31, 27, 34, 34, 30, 30, 26, 26, 26, 21, 21, 17
Draw the histogram for these data using an initial class boundary of 14.5, an ending class boundary of 49.5, and 5 classes of equal width. Note that you can add
or remove classes from the figure. Label each class with its endpoints.
Frequency
:lolo:0
x
?
7-
6+
5+
4+
3+
2+
0
0
0
Time (in days)

Answers: 1


Another question on Mathematics
Mathematics, 21.06.2019 17:30
Scrub a dub toothbrushes are $4.00 each. there is a 10% discount, but there is also a 6% sales tax after the discount is applied. what is the new price after tax? round to the nearest penny
Answers: 1
Mathematics, 21.06.2019 20:00
Wich statement could be used to explain why the function h(x)= x^3 has an inverse relation that is also a function
Answers: 3
Mathematics, 21.06.2019 20:00
Which expression is rational? 6. , square root two, square root 14, square root 49
Answers: 1
You know the right answer?
Below are the times (in days) it takes for a sample of 17 customers from Andrew's computer store to...
Questions

Mathematics, 30.03.2020 09:10
Mathematics, 30.03.2020 09:10
Mathematics, 30.03.2020 09:10


History, 30.03.2020 09:12
Mathematics, 30.03.2020 09:12
Mathematics, 30.03.2020 09:12
English, 30.03.2020 09:12

Physics, 30.03.2020 09:12
Mathematics, 30.03.2020 09:13
Mathematics, 30.03.2020 09:14


