Mathematics, 01.08.2020 17:01 sjackson0625p8w1a0
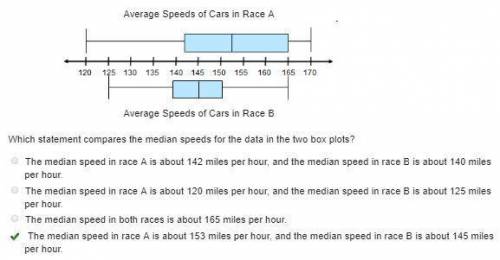
The box plots show the average speeds, in miles per hour, for the race cars in two different races. Average Speeds of Cars in Race A 2 box plots. The number line goes from 120 to 170. For Race A, the whiskers range from 120 to 170, and the box ranges from 143 to 165. A line divides the box at 153. For Race B, the whiskers range from 125 to 165, and the box ranges from 140 to 150. A line divides the box at 145. Average Speeds of Cars in Race B

Answers: 3


Another question on Mathematics

Mathematics, 21.06.2019 20:30
You’re giving a cube with a length of 2.5 cm and a width of 2.5 cm and a high of 2.5 cm you place it on a scale and it is 295 g calculate the density
Answers: 1

Mathematics, 22.06.2019 00:00
Abook store is having a 30 perscent off sale. diary of the wimpy kid books are now 6.30 dollars each what was the original price of the books
Answers: 1


Mathematics, 22.06.2019 01:00
Find the value of the variable and the length of each chord for #5 and #6.
Answers: 1
You know the right answer?
The box plots show the average speeds, in miles per hour, for the race cars in two different races....
Questions


Mathematics, 16.07.2019 12:50


Social Studies, 16.07.2019 12:50


Computers and Technology, 16.07.2019 12:50

History, 16.07.2019 12:50


English, 16.07.2019 12:50


History, 16.07.2019 12:50

Mathematics, 16.07.2019 12:50

Chemistry, 16.07.2019 12:50


Mathematics, 16.07.2019 12:50

Biology, 16.07.2019 12:50


