Mathematics, 13.10.2020 09:01 pedropaulofpedrosapp
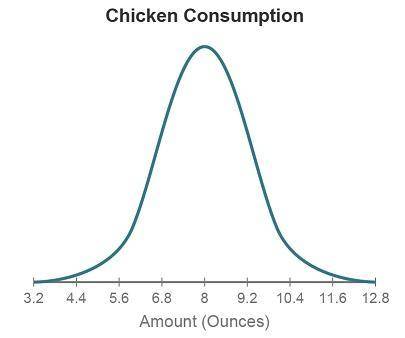
The graph shows the distribution of the amount of chicken (in ounces) that adults eat in one sitting. The distribution is approximately Normal, with a mean of 8 ounces and a standard deviation of 1.2 ounces.
What percentage of adults eat more than 10.4 ounces of chicken in one sitting?
2.5%
47.5%
95%
97.5%


Answers: 2


Another question on Mathematics

Mathematics, 21.06.2019 17:00
Aswimming pool is a rectangle with semicircles on the end. the rectangle is 12 meters wide and 30 meters long. the diameter and width of the swimming pool are equal. sketch and label an overhead diagram of the swimming pool. find the area of the swimming pool floor.
Answers: 1


Mathematics, 21.06.2019 18:00
The constant of proportionality is always the where k is the constant of proportionality. additionally, you can find the constant of proportionality by finding the ratio for any point onasap
Answers: 1

Mathematics, 21.06.2019 18:00
Plz a. s. a. p.the table shows the number of male and female contestants who did not win a prize. what is the probability that a randomly selected contestant won a prize, given that the contestant was female? write the probability as a percent. round to the neares tenth, if needed.
Answers: 1
You know the right answer?
The graph shows the distribution of the amount of chicken (in ounces) that adults eat in one sitting...
Questions

Computers and Technology, 29.06.2019 07:30

Biology, 29.06.2019 07:30


Mathematics, 29.06.2019 07:30


Mathematics, 29.06.2019 07:30


History, 29.06.2019 07:30

Mathematics, 29.06.2019 07:30

Biology, 29.06.2019 07:30


Computers and Technology, 29.06.2019 07:30

Computers and Technology, 29.06.2019 07:30

History, 29.06.2019 07:30

Computers and Technology, 29.06.2019 07:30

History, 29.06.2019 07:30


