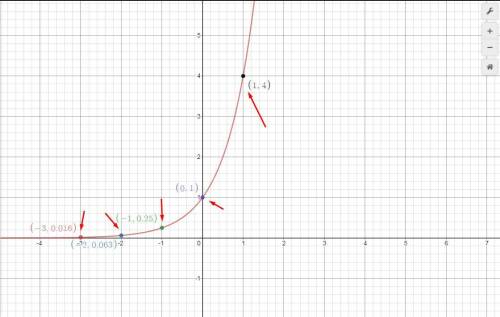
Graph the exponential function.
f(x) = 4^x
Plot five points on the graph of the function. The...

Mathematics, 18.10.2020 08:01 ramirez5571
Graph the exponential function.
f(x) = 4^x
Plot five points on the graph of the function. Then click on the graph-a-function button.

Answers: 2


Another question on Mathematics

Mathematics, 21.06.2019 20:30
Answer for 10 points show work you guys in advanced < 3
Answers: 1


Mathematics, 22.06.2019 01:30
In 2000, for a certain region, 27.1% of incoming college freshman characterized their political views as liberal, 23.1% as moderate, and 49.8% as conservative. for this year, a random sample of 400 incoming college freshman yielded the frequency distribution for political views shown below. a. determine the mode of the data. b. decide whether it would be appropriate to use either the mean or the median as a measure of center. explain your answer. political view frequency liberal 118 moderate 98 conservative 184 a. choose the correct answer below. select all that apply. a. the mode is moderate. b. the mode is liberal. c. the mode is conservative. d. there is no mode.
Answers: 1

Mathematics, 22.06.2019 02:10
Which diagram best shows how fraction bars can be used to evaluate 1/2 divided by 1/4?
Answers: 2
You know the right answer?
Questions

Mathematics, 12.02.2022 06:10

History, 12.02.2022 06:10


Social Studies, 12.02.2022 06:10


Mathematics, 12.02.2022 06:10


Mathematics, 12.02.2022 06:20


Mathematics, 12.02.2022 06:20


Mathematics, 12.02.2022 06:20


