Mathematics, 24.10.2020 21:50 NobleWho
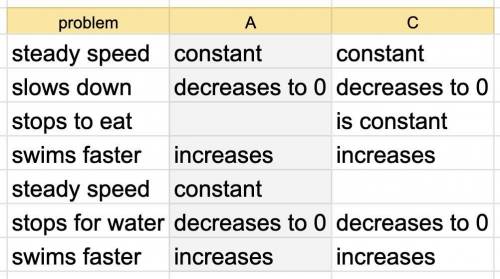
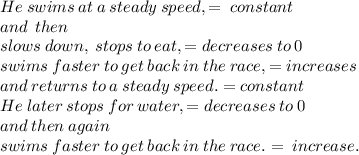
William is in the middle of swimming in a ten-mile race. He swims at a steady speed, and then slows down, stops to eat, swims faster to get back in the race, and returns to a steady speed. He later stops for water, and then again swims faster to get back in the race. Which graph best represents the situation?
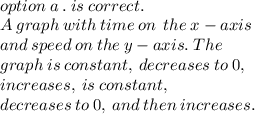
A graph with time on the x-axis and speed on the y-axis. The graph is constant, decreases to 0, increases, is constant, decreases to 0, and then increases.
A graph with time on the x-axis and speed on the y-axis. The graph decreases, is constant at 0, increases, is constant, decreases to 0, and then increases.
A graph with time on the x-axis and speed on the y-axis. The graph is constant, decreases to 0, is constant, increases, decreases to 0, and then increases.
A graph with time on the x-axis and speed on the y-axis. The graph is constant, decreases to 0, is constant, increases, and then is constant.

Answers: 1


Another question on Mathematics

Mathematics, 21.06.2019 18:30
True or false? a circle could be circumscribed about the quadrilateral below.
Answers: 3

Mathematics, 21.06.2019 18:30
What is the answer to this question? i'm a bit stumped. also how do i do it? 5(x - 4) = 2(x + 5)
Answers: 1

Mathematics, 21.06.2019 19:00
The ratio of the measures of the three angles in a triangle is 2: 9: 4. find the measures of the angels
Answers: 2

Mathematics, 21.06.2019 19:00
How can you tell when x and y are not directly proportional?
Answers: 1
You know the right answer?
William is in the middle of swimming in a ten-mile race. He swims at a steady speed, and then slows...
Questions


Biology, 25.06.2019 19:30


Physics, 25.06.2019 19:30


Physics, 25.06.2019 19:30

Mathematics, 25.06.2019 19:30

History, 25.06.2019 19:30

Mathematics, 25.06.2019 19:30

Mathematics, 25.06.2019 19:30

History, 25.06.2019 19:30


Mathematics, 25.06.2019 19:30

English, 25.06.2019 19:30

Social Studies, 25.06.2019 19:30


Mathematics, 25.06.2019 19:30


