
Mathematics, 03.12.2020 22:20 bermudezs732
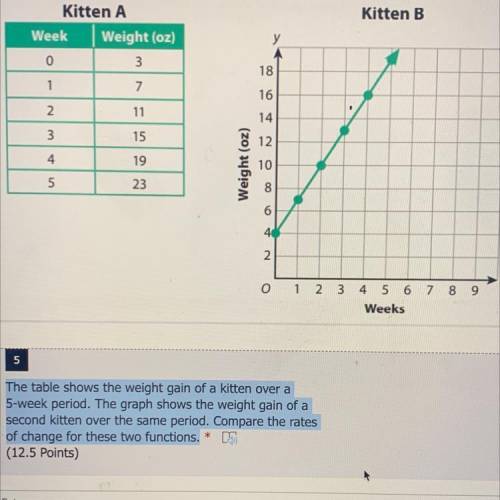
The table shows the weight gain of a kitten over a
5-week period. The graph shows the weight gain of a
second kitten over the same period. Compare the rates
of change for these two functions.

Answers: 2


Another question on Mathematics
Mathematics, 21.06.2019 16:30
What is the equation of a vertical line passing through the point (−5, −1)? y = −5 y = −1 x = −5 x = −1
Answers: 2
Mathematics, 21.06.2019 19:00
What is the equation of the line in point-slope form? y+ 4 = 1/2(x+4) y-4 = 1/2(x + 4) y-0 = 2(x - 4) y-4 = 2(8-0)
Answers: 2
Mathematics, 21.06.2019 20:00
Can someone factor this fully? my friend and i have two different answers and i would like to know if either of them is right. you in advance. a^2 - b^2 + 25 + 10a
Answers: 1
Mathematics, 21.06.2019 21:10
Mackenzie needs to determine whether the rectangles are proportional. which process could she use? check all that apply.
Answers: 1
You know the right answer?
The table shows the weight gain of a kitten over a
5-week period. The graph shows the weight gain o...
Questions
Mathematics, 10.07.2019 00:00

English, 10.07.2019 00:00


Biology, 10.07.2019 00:00
Mathematics, 10.07.2019 00:00
English, 10.07.2019 00:00

History, 10.07.2019 00:00
Biology, 10.07.2019 00:00
Mathematics, 10.07.2019 00:00
Mathematics, 10.07.2019 00:00


Mathematics, 10.07.2019 00:00


