Mathematics, 07.12.2020 02:20 lizsd2004
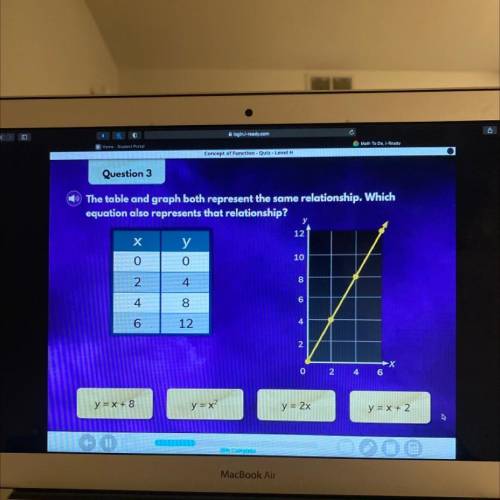
The table and graph both represent the same relationship. Which
equation also represents that relationship?
у
12
х
у
0
10
2
4
00
0
6
4
8
6
12
4
2
0
2
4
6


Answers: 3


Another question on Mathematics

Mathematics, 21.06.2019 21:00
Reagan lives five miles farther from school than vanessa lives. write an expression to describe how far reagan lives from school
Answers: 1

Mathematics, 21.06.2019 21:30
Anumber cube is rolled two times in a row. find the probability it will land on 2 on the first roll and a number greater then 4 on the second roll
Answers: 1

Mathematics, 21.06.2019 21:30
Name and describe the three most important measures of central tendency. choose the correct answer below. a. the mean, sample size, and mode are the most important measures of central tendency. the mean of a data set is the sum of the observations divided by the middle value in its ordered list. the sample size of a data set is the number of observations. the mode of a data set is its highest value in its ordered list. b. the sample size, median, and mode are the most important measures of central tendency. the sample size of a data set is the difference between the highest value and lowest value in its ordered list. the median of a data set is its most frequently occurring value. the mode of a data set is sum of the observations divided by the number of observations. c. the mean, median, and mode are the most important measures of central tendency. the mean of a data set is the product of the observations divided by the number of observations. the median of a data set is the lowest value in its ordered list. the mode of a data set is its least frequently occurring value. d. the mean, median, and mode are the most important measures of central tendency. the mean of a data set is its arithmetic average. the median of a data set is the middle value in its ordered list. the mode of a data set is its most frequently occurring value.
Answers: 3

Mathematics, 21.06.2019 23:30
Astudent must have an average on five test that is greater than it equal to 80% but less than 90% to receive a final grade of b. devon's greades on the first four test were 78% 62% 91% and 80% what range if grades on the fifth test would give him a b in the course? ( assuming the highest grade is 100%)
Answers: 1
You know the right answer?
The table and graph both represent the same relationship. Which
equation also represents that relat...
Questions

Computers and Technology, 26.08.2019 02:20

Mathematics, 26.08.2019 02:20


Mathematics, 26.08.2019 02:20

History, 26.08.2019 02:20

English, 26.08.2019 02:20


Biology, 26.08.2019 02:20


Mathematics, 26.08.2019 02:20


Biology, 26.08.2019 02:20

Mathematics, 26.08.2019 02:20


Mathematics, 26.08.2019 02:20


