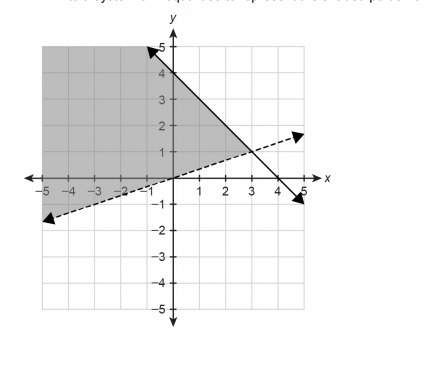
and y≤ -x +4 .
step-by-step explanation:
we are given a graph for system of inequalities.
in order to write the system of inequalities for the given graph, we need to find the inequality for each of the line separately.
let us find the slope of dotted line first.
taking two coordinates on the graph.
let us say (0,0) and (3,1).
let us find the slope of the line now.
slope of the dotted line would be = .
.
y-intercept of dotted line is y=0 only.
plugging slope m=  and b=0 in slope-intercept form y=mx+b, we get
 .
.
the line is shaded up of that dotted line.
therefore, for shading up we would take greater than inequality symbol > .
and because it's a dotted line we would take only > symbol in place of = sign in above equation of line.
therefore, inequality for dotted line would be

.
let us take two points (3,1) and (0,4) on the solid line.
slope of the solid line would be = .
.
for the solid line we have y-intercept b= 4.
plugging slope m= -1 and b=4 in slope-intercept form y=mx+b, we get
y = -1x + 4.
the line is shaded down of that solid line.
therefore, for shading down we would take less than inequality symbol < .
and because it's a solid line we would take ≤ symbol in place of = sign in above equation of line.
therefore, inequality for solid line would be
y≤ -x +4 .


