Mathematics, 09.12.2020 21:30 meliac
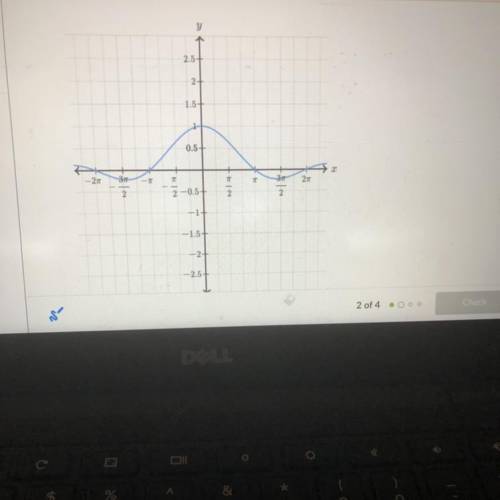
The illustration below shows the graph of y as a function of z.
Complete the following sentences based on the graph of the function.
function.
. This is the graph of a
. The y-intercept of the graph is the function value y-
. The smallest positive T-intercept of the graph is located at
. The greatest value of y is y =
,and it occurs when
.For z between z=1 and z = 2T, the function value y
2.5+


Answers: 3


Another question on Mathematics

Mathematics, 20.06.2019 18:04
For an experiment, a penny is tossed. at the same time, a spinner with 8 congruent sections numbered 1–8 is spun. how many possible outcomes are there for the experiment?
Answers: 1

Mathematics, 21.06.2019 15:30
Find the number of positive three-digit even integers whose digits are among 9, 8, 7,5, 3, and 1.
Answers: 2

Mathematics, 21.06.2019 16:20
Which mathematical statements are true? 1) if 3 is an odd number, then 3 times 3 is an even number. 2) if 6 is less than 7, then 4 is greater than 7. 3) six is divisible by 3, and 10 is a multiple of 2. 4) the average of the data is greater than the largest value in the data, or it’s less than the largest value in the data. 5) the slope of a linear graph is its rate of change, and the graph’s y-intercept is the initial value. 6) if an equilateral triangle has equal angles, then all its angles will measure 45°.
Answers: 3

Mathematics, 21.06.2019 20:30
Kayaks rent for $35 per day. which expression can you use to find the cost in dollars of renting 3 kayaks for a day?
Answers: 1
You know the right answer?
The illustration below shows the graph of y as a function of z.
Complete the following sentences ba...
Questions


Mathematics, 30.03.2020 03:11

Mathematics, 30.03.2020 03:11

Mathematics, 30.03.2020 03:11

Mathematics, 30.03.2020 03:12


Mathematics, 30.03.2020 03:14

Medicine, 30.03.2020 03:14

Social Studies, 30.03.2020 03:14


Mathematics, 30.03.2020 03:14

Mathematics, 30.03.2020 03:14


Mathematics, 30.03.2020 03:16

Mathematics, 30.03.2020 03:17


History, 30.03.2020 03:26


