
Mathematics, 15.12.2020 04:00 deanperez2637
Which
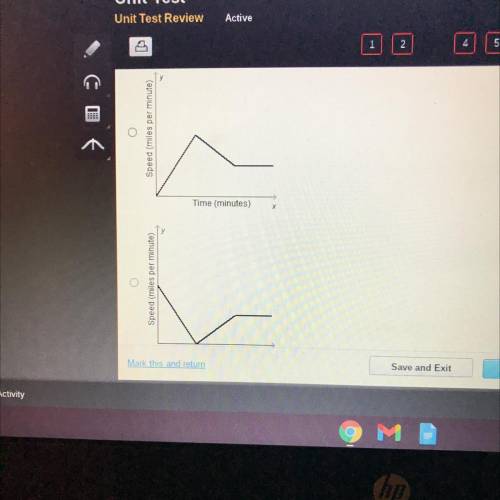
graph could represent a car that begins by increasing its speed, then travels at a constant speed, and then
decreases its speed, as time increases?

Answers: 2


Another question on Mathematics
Mathematics, 21.06.2019 16:20
Taking algebra two apex courses and need with these questions
Answers: 1
Mathematics, 21.06.2019 18:00
The base of a triangle exceeds the height by 7 centimeters. if the area is 400 square centimeters, find the length of the base and the height of the triangle.
Answers: 1
Mathematics, 21.06.2019 20:20
Recall that the owner of a local health food store recently started a new ad campaign to attract more business and wants to know if average daily sales have increased. historically average daily sales were approximately $2,700. the upper bound of the 95% range of likely sample means for this one-sided test is approximately $2,843.44. if the owner took a random sample of forty-five days and found that daily average sales were now $2,984, what can she conclude at the 95% confidence level?
Answers: 1
You know the right answer?
Which
graph could represent a car that begins by increasing its speed, then travels at a constant s...
Questions

Biology, 20.07.2019 10:30
Mathematics, 20.07.2019 10:30

History, 20.07.2019 10:30

Physics, 20.07.2019 10:30
History, 20.07.2019 10:30
Mathematics, 20.07.2019 10:30

Computers and Technology, 20.07.2019 10:30
Physics, 20.07.2019 10:30
Physics, 20.07.2019 10:30


