
Mathematics, 16.12.2020 03:50 Weser17
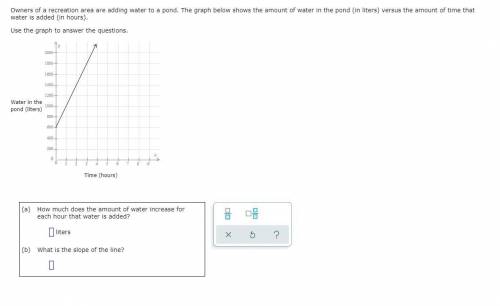
Owners of a recreation area are adding water to a pond. The graph below shows the amount of water in the pond (in liters) versus the amount of time that water is added (in hours). Use the graph to answer the questions.

Answers: 1


Another question on Mathematics
Mathematics, 21.06.2019 22:00
20 points 1. your friend, taylor, missed class today and needs some identifying solutions to systems. explain to taylor how to find the solution(s) of any system using its graph. 2. taylor graphs the system below on her graphing calculator and decides that f(x)=g(x) at x=0, x=1, and x=3. provide taylor some feedback that explains which part of her answer is incorrect and why it is incorrect. f(x)=2x+1 g(x)=2x^2+1
Answers: 2
Mathematics, 21.06.2019 23:20
Which expression is a factor of 12x2 + 29x – 8? x – 8 2x – 1 3x + 8 4x + 1
Answers: 1
Mathematics, 22.06.2019 01:50
According to a study done by de anza students, the height for asian adult males is normally distributed with an average of 66 inches and a standard deviation of 2.5 inches. suppose one asian adult male is randomly chosen. let x = height of the individual. a) give the distribution of x. x ~ b) find the probability that the person is between 64 and 69 inches. write the probability statement. what is the probability?
Answers: 2
Mathematics, 22.06.2019 02:30
Atrain traveled for 1.5 hours to the first station, stopped for 30 minutes, then traveled for 4 hours to the final station where it stopped for 1 hour. the total distance traveled is a function of time. which graph most accurately represents this scenario? a graph is shown with the x-axis labeled time (in hours) and the y-axis labeled total distance (in miles). the line begins at the origin and moves upward for 1.5 hours. the line then continues upward at a slow rate until 2 hours. from 2 to 6 hours, the line continues quickly upward. from 6 to 7 hours, it moves downward until it touches the x-axis a graph is shown with the axis labeled time (in hours) and the y axis labeled total distance (in miles). a line is shown beginning at the origin. the line moves upward until 1.5 hours, then is a horizontal line until 2 hours. the line moves quickly upward again until 6 hours, and then is horizontal until 7 hours a graph is shown with the axis labeled time (in hours) and the y-axis labeled total distance (in miles). the line begins at the y-axis where y equals 125. it is horizontal until 1.5 hours, then moves downward until 2 hours where it touches the x-axis. the line moves upward until 6 hours and then moves downward until 7 hours where it touches the x-axis a graph is shown with the axis labeled time (in hours) and the y-axis labeled total distance (in miles). the line begins at y equals 125 and is horizontal for 1.5 hours. the line moves downward until 2 hours, then back up until 5.5 hours. the line is horizontal from 5.5 to 7 hours
Answers: 1
You know the right answer?
Owners of a recreation area are adding water to a pond. The graph below shows the amount of water in...
Questions
Mathematics, 16.12.2020 06:00


Health, 16.12.2020 06:00
Mathematics, 16.12.2020 06:00
English, 16.12.2020 06:00
Mathematics, 16.12.2020 06:00
Health, 16.12.2020 06:00
Mathematics, 16.12.2020 06:00

Social Studies, 16.12.2020 06:00
Mathematics, 16.12.2020 06:00
SAT, 16.12.2020 06:00

Mathematics, 16.12.2020 06:00


