Mathematics, 25.01.2021 19:30 jay5902
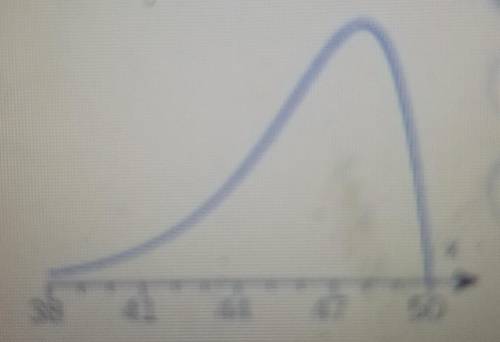
Determine whether the graph shown could represent a variable with a normal distribution. Explain your reasoning. If the graph appears to represent a normal distribution, estimate the mean and standard deviation.


Answers: 3


Another question on Mathematics


Mathematics, 21.06.2019 13:30
The number of pages in the u.s. tax code exceeds the number of pages in the king james bible by 18,528. the combined number of pages in the tax code and the bible is 21,472
Answers: 2

Mathematics, 21.06.2019 19:00
Quadrilateral abcd in the figure below represents a scaled-down model of a walkway around a historic site. quadrilateral efgh represents the actual walkway. abcd is similar to efgh. what is the total length, in feet of the actual walkway?
Answers: 2

Mathematics, 21.06.2019 20:00
The art class is planning to paint a mural on an outside wall. this figure is a scale drawing of the wall. width: 11 in length: 28 in unit rate: 1.5 ft per in. write the ratio of the area of the drawing to the area of the actual mural. write your answer as a unit rate. show that this unit rate is equal to the square of the unit rate 1.5 ft per in
Answers: 1
You know the right answer?
Determine whether the graph shown could represent a variable with a normal distribution. Explain you...
Questions

Computers and Technology, 29.04.2021 19:10

Mathematics, 29.04.2021 19:10


Mathematics, 29.04.2021 19:10

Mathematics, 29.04.2021 19:10

Arts, 29.04.2021 19:10


History, 29.04.2021 19:10


English, 29.04.2021 19:10


Chemistry, 29.04.2021 19:10

Mathematics, 29.04.2021 19:10


