Mathematics, 18.02.2021 22:00 harlon852
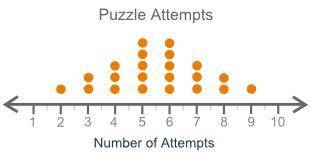
(08.06)The dot plot shows how many attempts it took for each student to complete a puzzle:
Dot plot titled Puzzle Attempts and labeled Number of Attempts shows number line from 1 to 10. There are no dots over 1 and 10, 1 dot over 2 and 9, 2 dots over 3 and 8, 3 dots over 4 and 7, 5 dots over 5 and 6.
Is the median or the mean a better measure of center for these data and why?
A. Mean, because the data are skewed and there are outliers
B. Mean, because the data are symmetric and there are no outliers
C. Median, because the data are skewed and there are outliers
D. Median, because the data are symmetric and there are no outliers


Answers: 2


Another question on Mathematics

Mathematics, 21.06.2019 21:00
Rewrite the following quadratic functions in intercept or factored form. show your work. y = 4x^2 - 19x- 5
Answers: 2

Mathematics, 21.06.2019 22:30
Tommy buys a sweater that is on sale for 40% off the original price. the expression p -0.4p can be used to find the sale price of the sweater, where p is the original price of the sweater. if the original price of the sweater is 50, what is the sale price?
Answers: 1

Mathematics, 21.06.2019 23:00
Jim had 3,067.48 in his checking account he wrote a check to pay for two airplane tickets. his account now has 1,845.24.
Answers: 1

Mathematics, 21.06.2019 23:30
Xy x xy if a and b are positive integers such that a*b=9 and b*a=72 what is the value of a/b
Answers: 3
You know the right answer?
(08.06)The dot plot shows how many attempts it took for each student to complete a puzzle:
Dot plot...
Questions


History, 02.11.2019 02:31


Mathematics, 02.11.2019 02:31


History, 02.11.2019 02:31

Business, 02.11.2019 02:31


Chemistry, 02.11.2019 02:31

Mathematics, 02.11.2019 02:31


