
Mathematics, 25.02.2021 05:50 kiki6930
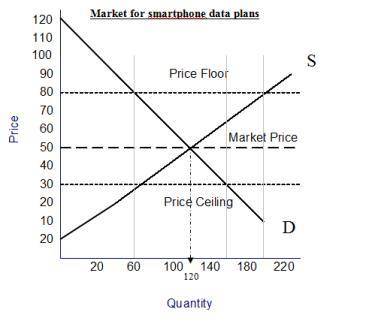
According to the graph above, what is the quantity supplied and quantity demanded at $50
A) QS= 100 and QD=120
B) QS= 100 and QD=100
C) QS= 120 and QD=100
D) QS= 120 and QD=120

Answers: 2


Another question on Mathematics
Mathematics, 21.06.2019 16:50
The verbal translation for the difference of m and 7 increased by 15
Answers: 3
Mathematics, 21.06.2019 21:00
These box plots show the number of electoral votes one by democratic and republican presidential candidates for the elections from 1984 through 2012. which statement best compares the spread of the data sets
Answers: 2
Mathematics, 22.06.2019 00:00
Round each decimal to the nearest thousandth. a. 5.39562 b. 0.12345 c. 5634 d. 18.93763
Answers: 1
Mathematics, 22.06.2019 03:10
The coverage of a base station of a telecommunication company forms a disk with a radius of (kilometers). let be the distance of a cellphone from a base station. assume that the location of cellphones in use are randomly uniformly distributed within the disk. calculate the mean and variance for the random variable.
Answers: 3
You know the right answer?
According to the graph above, what is the quantity supplied and quantity demanded at $50
A) QS= 100...
Questions

English, 01.10.2019 08:00
Mathematics, 01.10.2019 08:00

History, 01.10.2019 08:00
History, 01.10.2019 08:00

Chemistry, 01.10.2019 08:00
History, 01.10.2019 08:00
History, 01.10.2019 08:00
Mathematics, 01.10.2019 08:00
Mathematics, 01.10.2019 08:00

Biology, 01.10.2019 08:00

Health, 01.10.2019 08:00

Social Studies, 01.10.2019 08:00


