Mathematics, 25.02.2021 08:20 tiffanyheist
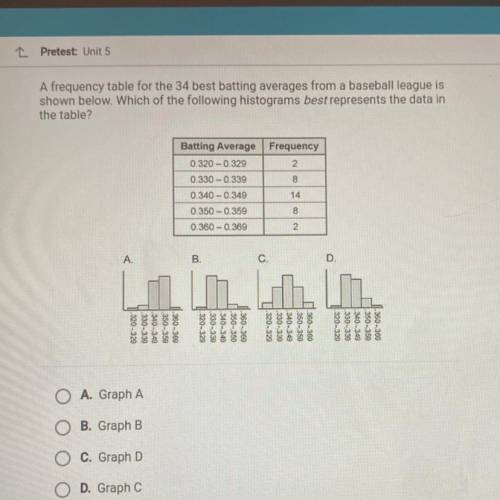
A frequency table for the 34 best batting averages from a baseball league is
shown below. Which of the following histograms best represents the data in
the table?
Frequency
2
Batting Average
0.320 -0.329
0.330 -0.339
0.340 -0.349
0.350 - 0.359
0.360 -0.369
0000
A.
B.
C.
.320-329
-330-339
1.340-349
.350-350
360-360
320-329
:330-339
.340-349
.350-359
.360-360
.320-329
-330-339
.340-349
.350 - 350
.360-360
-320-320
.330-339
340-349
350-350
.360-369
A. Graph A
B. Graph B
C. Graph D
O D. Graph C


Answers: 1


Another question on Mathematics

Mathematics, 21.06.2019 14:00
The line y = x + passes through (−3, 7) and is parallel to y = 4x − 1.
Answers: 1

Mathematics, 21.06.2019 14:30
Atriangular bandana has an area of 46 square inches. the height of the triangle is 5 3 4 inches. enter and solve an equation to find the length of the base of the triangle. use b to represent the length of the base.
Answers: 2

Mathematics, 21.06.2019 20:30
Solve each quadratic equation by factoring and using the zero product property. 10x + 6 = -2x^2 -2
Answers: 2

Mathematics, 22.06.2019 01:00
Mia’s gross pay is 2953 her deductions total 724.15 what percent if her gross pay is take-home pay
Answers: 1
You know the right answer?
A frequency table for the 34 best batting averages from a baseball league is
shown below. Which of...
Questions

History, 10.04.2020 23:51

Mathematics, 10.04.2020 23:51


Mathematics, 10.04.2020 23:51


Mathematics, 10.04.2020 23:51


Mathematics, 10.04.2020 23:51


