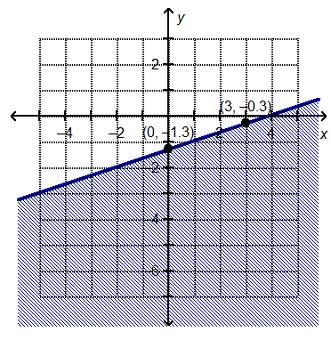
We will proceed to graph each case to determine the solution of the problem.
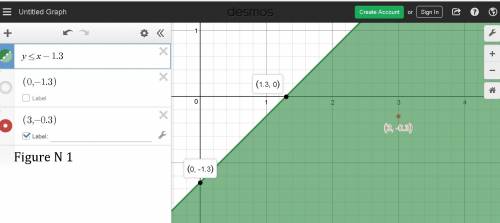
case a) 
Using a graph tool
see the attached figure N 
The solution is the shaded area
The inequality of the case a) is not represented by the graph
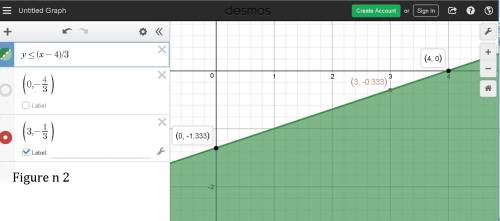
case b) 
Using a graph tool
see the attached figure N 
The solution is the shaded area
The inequality of the case b) is represented by the graph
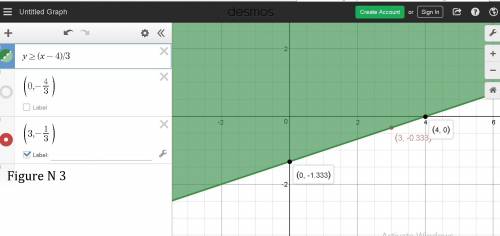
case c) 
Using a graph tool
see the attached figure N 
The solution is the shaded area
The inequality of the case c) is not represented by the graph
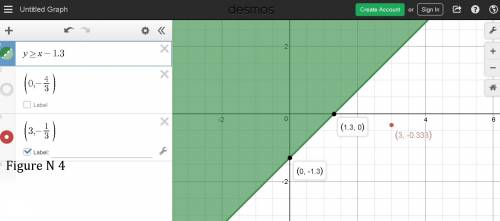
case d) 
Using a graph tool
see the attached figure N 
The solution is the shaded area
The inequality of the case d) is not represented by the graph
therefore
the answer is
The inequality  is represented by the graph
