Mathematics, 26.03.2021 15:00 nguyendavis17
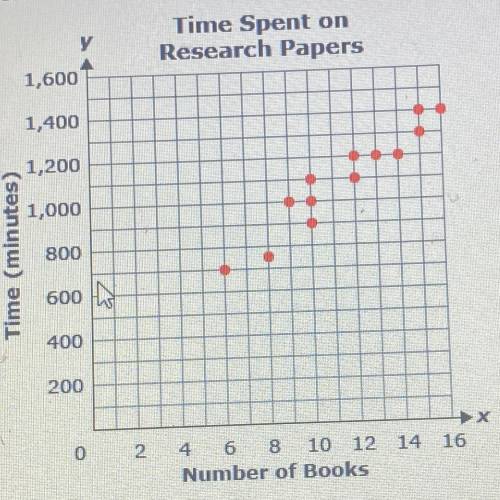
The scatter plot below shows the total time (/), in minutes, 13 students spent working on their research papers based on the
number of books (x) they used as resources
Time Spent on
Research Papers
Based on the scatter plot, which equation represents the line of best fit for the time the students spent working on research
papers?
A. y = 70.28x + 285.21
B. y = 87.5x
C. y = 87.5x + 700
D. y = 70.28x


Answers: 1


Another question on Mathematics

Mathematics, 21.06.2019 13:40
Solve the equation 3x2 + 19x + 9 = 0 to the nearest tenth.
Answers: 1

Mathematics, 21.06.2019 18:30
Players on the school soccer team are selling candles to raise money for an upcoming trip. each player has 24 candles to sell. if a player sells 4 candles a profit of$30 is made. if he sells 12 candles a profit of $70 is made
Answers: 2

Mathematics, 21.06.2019 20:20
Each person in an it department of 25 people works on at least one of 3 major projects: system security, program implementation, platform development. 10 people work on system security, 13 work on program implementation, and 12 work on platform development. 4 people work on system security and platform development, 5 people work on program implementation and platform development, and 2 people work on all three projects. how many people work on system security and program implementation?
Answers: 1

You know the right answer?
The scatter plot below shows the total time (/), in minutes, 13 students spent working on their rese...
Questions


Mathematics, 02.01.2020 11:31

Social Studies, 02.01.2020 11:31

Mathematics, 02.01.2020 11:31


English, 02.01.2020 11:31


History, 02.01.2020 11:31


Health, 02.01.2020 11:31

Mathematics, 02.01.2020 11:31


Mathematics, 02.01.2020 11:31


