
Mathematics, 29.03.2021 14:00 gobbler80
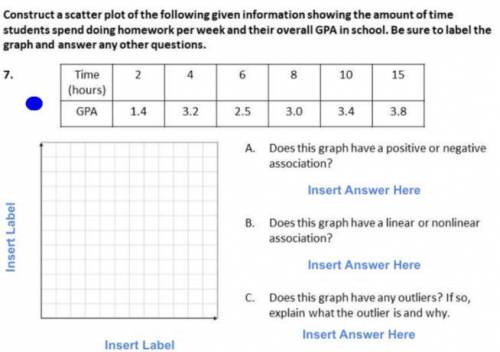
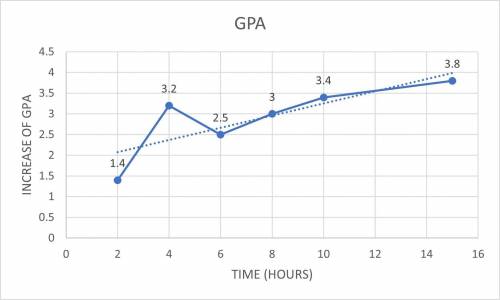
Construct a scatter plot of the following given information showing the amount of time students spend doing homework per week and their overall GPA in school. Be sure to label the graph and answer any other questions.

Answers: 3


Another question on Mathematics
Mathematics, 21.06.2019 13:50
James wants to promote his band on the internet. site a offers website hosting for $4.95 per month with a $49.95 startup fee. site b offers website hosting for $9.95 per month with no startup fee. for how many months would james need to keep the website for site a to be a better choice than site b? 1. define a variable for the situation. 2. write an inequality that represents the situation. 3.solve the inequality to find out how many months he needs to keep the website for site a to be less expensive than site b. 4. using words, describe how many months he needs to keep the website for site a to be less expensive than site b.
Answers: 3
Mathematics, 21.06.2019 21:10
The equation |pl = 2 represents the total number of points that can be earned or lost during one turn of a game. which best describes how many points can be earned or lost during one turn? o o -2 2 oor 2 -2 or 2 o
Answers: 1
You know the right answer?
Construct a scatter plot of the following given information showing the amount of time students spen...
Questions
Mathematics, 14.01.2021 02:20

Mathematics, 14.01.2021 02:20


English, 14.01.2021 02:20


History, 14.01.2021 02:20

Spanish, 14.01.2021 02:20
Mathematics, 14.01.2021 02:20

Mathematics, 14.01.2021 02:20
Mathematics, 14.01.2021 02:20
Mathematics, 14.01.2021 02:20
Biology, 14.01.2021 02:20


