Mathematics, 06.04.2021 05:10 nnaomii
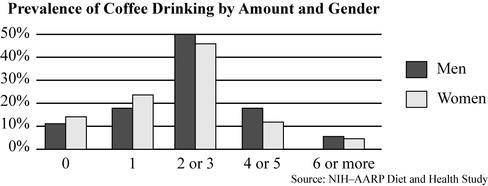
The double bar graph below shows the number of cups of coffee that a large random sample of people consumed, broken down by gender.
What inference can be made based on this data?
A - Men and women drink the same amount of coffee per day on average.
B - More men than women drink at least two cups of coffee a day.
C - Men drink more coffee per day than women on average.
D - Women drink more coffee per day than men on average.


Answers: 1


Another question on Mathematics


Mathematics, 21.06.2019 21:30
Which best describes the construction of a triangle if given the segment lengths of 2 cm, 3 cm, and 5 cm? a) unique triangle b) cannot be determined c) triangle not possible d) more than one triangle
Answers: 1


Mathematics, 22.06.2019 00:30
When you flip a biased coin the probability of getting a tail is 0.6. how many times would you expect to get tails if you flip the coin 320 times?
Answers: 1
You know the right answer?
The double bar graph below shows the number of cups of coffee that a large random sample of people c...
Questions

Health, 31.07.2019 14:00

Mathematics, 31.07.2019 14:00

Mathematics, 31.07.2019 14:00

Physics, 31.07.2019 14:00

History, 31.07.2019 14:00


Mathematics, 31.07.2019 14:00

Mathematics, 31.07.2019 14:00


English, 31.07.2019 14:00

English, 31.07.2019 14:00


Computers and Technology, 31.07.2019 14:00

Chemistry, 31.07.2019 14:00


