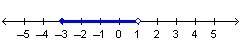
Which compound inequality is represented by the graph?
–3 ≤ x < 1
–3 < x...

Mathematics, 05.11.2019 19:31 adamlane023
Which compound inequality is represented by the graph?
–3 ≤ x < 1
–3 < x ≤ 1
x ≤ –3 or x > 1
x < –3 or x ≥ 1

Answers: 3


Another question on Mathematics
Mathematics, 21.06.2019 19:30
Nikolas calculated the volume of the prism. his work is shown below.
Answers: 1
Mathematics, 21.06.2019 23:00
Janie has $3. she earns $1.20 for each chore she does and can do fractions of chores. she wants to earn enough money to buy a cd for $13.50.
Answers: 1
Mathematics, 22.06.2019 03:50
This stem-and-leaf plot represents the heights of the students on ralph’s basketball team. one student’s height is missing from the plot. if the mean height of all the students on the team is 61 inches, what is the missing height? a. 55 in. b. 59 in. c. 61 in. d. 65 in.
Answers: 1
Mathematics, 22.06.2019 04:00
Mrs. chibas is making chocolate chip cookies for her daughter's class. she bought a tub of chocolate chip cookie dough that contained 57.6 ounces of dough. if each cookie needs 1.2 ounces of dough, how many cookies can she make
Answers: 1
You know the right answer?
Questions

Mathematics, 08.12.2020 05:10

History, 08.12.2020 05:10
Mathematics, 08.12.2020 05:10

Health, 08.12.2020 05:10

Mathematics, 08.12.2020 05:10
Mathematics, 08.12.2020 05:10
Mathematics, 08.12.2020 05:10

Mathematics, 08.12.2020 05:10
Mathematics, 08.12.2020 05:10
English, 08.12.2020 05:10


