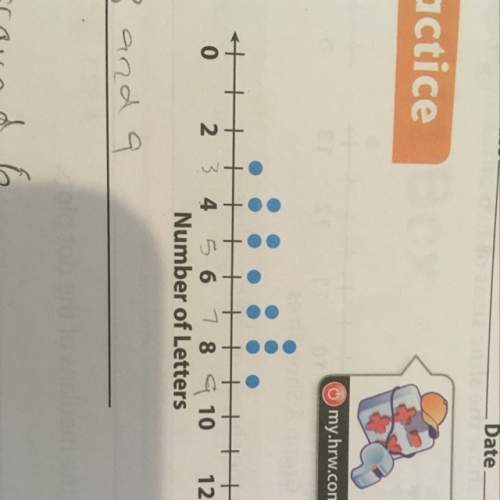
Calculate the mean, median, and range of the data in the dot plot. show/ explain your work.
...

Mathematics, 26.09.2019 14:30 jenna34032
Calculate the mean, median, and range of the data in the dot plot. show/ explain your work.

Answers: 1


Another question on Mathematics
Mathematics, 21.06.2019 14:30
Explain why the two figures below are not similar. use complete sentences and provide evidence to support your explanation. (10 points) figure abcdef is shown. a is at negative 4, negative 2. b is at negative 3, 0. c is at negative 4, 2. d is at negative 1, 2. e
Answers: 3
Mathematics, 21.06.2019 15:30
The local farm is advertising a special on fresh picked peaches. the farm charges $4.25 to pick your own peck of peaches and $3.50 for each additional peck you pick. write an equation for the total cost of peaches in terms of the number of pecks. deine your variables. how much does it cost to pick 3 pecks of peaches?
Answers: 3
Mathematics, 21.06.2019 19:00
Since opening night, attendance at play a has increased steadily, while attendance at play b first rose and then fell. equations modeling the daily attendance y at each play are shown below, where x is the number of days since opening night. on what day(s) was the attendance the same at both plays? what was the attendance? play a: y = 8x + 191 play b: y = -x^2 + 26x + 126 a. the attendance was never the same at both plays. b. the attendance was the same on day 5. the attendance was 231 at both plays on that day. c. the attendance was the same on day 13. the attendance was 295 at both plays on that day. d. the attendance was the same on days 5 and 13. the attendance at both plays on those days was 231 and 295 respectively.
Answers: 1
You know the right answer?
Questions

Mathematics, 14.12.2019 01:31


Biology, 14.12.2019 01:31
Mathematics, 14.12.2019 01:31
Mathematics, 14.12.2019 01:31

Social Studies, 14.12.2019 01:31
Chemistry, 14.12.2019 01:31


