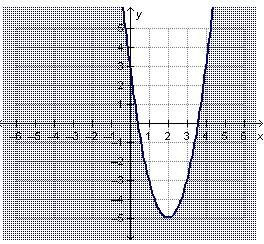
Which quadratic inequality does the graph below represent?
a) y≤2x²-8x+3
b) y≥2x²...

Mathematics, 20.10.2019 15:50 Sabby5069
Which quadratic inequality does the graph below represent?
a) y≤2x²-8x+3
b) y≥2x²=8x+3
c) y≤2x²-8x-3
d) y≥2x²-8x+3

Answers: 2


Another question on Mathematics
Mathematics, 21.06.2019 17:00
At the beginning of the day, stock xyz opened at $6.12. at the end of the day, it closed at $6.88. what is the rate of change of stock xyz? a. 1.17% b. 11.0% c. 12.4% d. 81.5%
Answers: 1
Mathematics, 21.06.2019 17:30
Two customers went to a post office. first customer paid $12 for 14 and 5 envelopes the second paid 24.80 for 10 postcards and 15 envelopes. what is cost of each envelope?
Answers: 1
Mathematics, 21.06.2019 22:00
Thanh and her crew are building a stage in the shape of a trapezoid for an upcoming festival. the lengths of the parallel sides of the trapezoid are 14 ft and 24 ft. the height of the trapezoid is 12 ft.what is the area of the stage? enter your answer in the box. ft²
Answers: 2
Mathematics, 21.06.2019 22:10
In which direction does the left side of the graph of this function point? a(x) = 3x - x2 + 4x - 2
Answers: 3
You know the right answer?
Questions
Mathematics, 14.09.2021 05:40
Mathematics, 14.09.2021 05:40

Chemistry, 14.09.2021 05:40


Social Studies, 14.09.2021 05:40

Computers and Technology, 14.09.2021 05:40

Mathematics, 14.09.2021 05:40
English, 14.09.2021 05:40


Mathematics, 14.09.2021 05:40


