Mathematics, 28.04.2021 18:30 user1234536
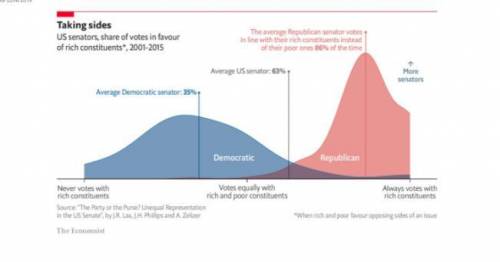
The following graph from the Economist, July 22, 2019 (Link to Economist Article) shows two curves that are approximately normal.
What is the mean of each curve?
Estimate the standard deviation (using the point of inflection or range rule of thumb).
What do the mean and standard deviation tell you about the way Republicans and Democrats in Congress vote?
After your initial post, respond to two others in your group. What conclusions did you share, and what did you interpret differently?


Answers: 3


Another question on Mathematics

Mathematics, 21.06.2019 21:20
An office supply company conducted a survey before marketing a new paper shredder designed for home use. in the survey, 80 % of the people who tried the shredder were satisfied with it. because of this high satisfaction rate, the company decided to market the new shredder. assume that 80 % of all people are satisfied with this shredder. during a certain month, 100 customers bought this shredder. find the probability that of these 100 customers, the number who are satisfied is 69 or fewer.
Answers: 2

Mathematics, 21.06.2019 22:00
What is the length of the segment, endpoints of which are intersections of parabolas y=x^2− 11/4 x− 7/4 and y=− 7 /8 x^2+x+ 31/8 ?
Answers: 1

Mathematics, 21.06.2019 22:30
3. a sum of $2700 is to be given in the form of 63 prizes. if the prize is of either $100 or $25, find the number of prizes of each type.
Answers: 1

Mathematics, 21.06.2019 23:10
What is the distance between the points (2, 5) and (5,9)?
Answers: 1
You know the right answer?
The following graph from the Economist, July 22, 2019 (Link to Economist Article) shows two curves t...
Questions


Computers and Technology, 10.01.2020 03:31


