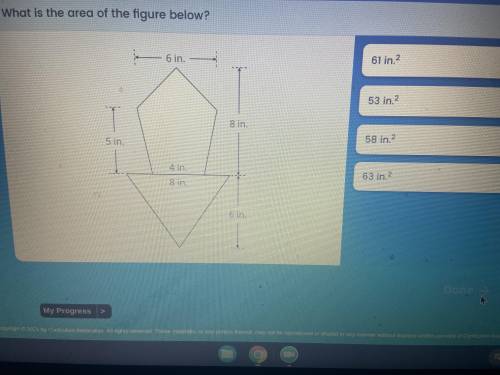
What is the area of the figure below
...

Answers: 3


Another question on Mathematics

Mathematics, 21.06.2019 19:50
Which of the following describes the graph of y--4x-36 compared to the parent square root function? stretched by a factor of 2, reflected over the x-axis, and translated 9 units right stretched by a factor of 2, reflected over the x-axis, and translated 9 units left stretched by a factor of 2, reflected over the y-axis, and translated 9 units right stretched by a factor of 2, reflected over the y-axis, and translated 9 units left save and exit next submit
Answers: 1

Mathematics, 21.06.2019 20:20
Recall that the owner of a local health food store recently started a new ad campaign to attract more business and wants to know if average daily sales have increased. historically average daily sales were approximately $2,700. the upper bound of the 95% range of likely sample means for this one-sided test is approximately $2,843.44. if the owner took a random sample of forty-five days and found that daily average sales were now $2,984, what can she conclude at the 95% confidence level?
Answers: 1

Mathematics, 21.06.2019 23:30
Scenario: a rectangular plot of ground is 5 meters longer than it is wide. its area is 20,000 square meters. question: what equation will you find the dimensions? note: let w represent the width. options: w(w+5)=20,000 w^2=20,000+5 (w(w+5))/2=20,000 w+2(w+5)=20,000
Answers: 1

Mathematics, 21.06.2019 23:30
In a study of the relationship between socio-economic class and unethical behavior, 129 university of california undergraduates at berkeley were asked to identify themselves as having low or high social-class by comparing themselves to others with the most (least) money, most (least) education, and most (least) respected jobs. they were also presented with a jar of individually wrapped candies and informed that the candies were for children in a nearby laboratory, but that they could take some if they wanted. after completing some unrelated tasks, participants reported the number of candies they had taken. it was found that those who were identiď¬ed as upper-class took more candy than others. in this study, identify: (a) the cases, (b) the variables and their types, (c) the main research question, (d) identify the population of interest and the sample in this study, and (e) comment on whether or not the results of the study can be generalized to the population, and if the ď¬ndings of the study can be used to establish causal relationships.
Answers: 2
You know the right answer?
Questions

Mathematics, 11.10.2019 01:00


Mathematics, 11.10.2019 01:00


Mathematics, 11.10.2019 01:00


Chemistry, 11.10.2019 01:00


Mathematics, 11.10.2019 01:00

English, 11.10.2019 01:00

History, 11.10.2019 01:00


