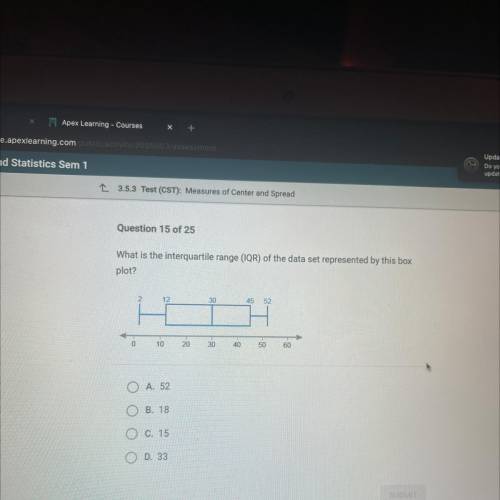
What is the interquartile range (IQR) of the data set represented by this box
plot?
2
1...

Mathematics, 13.08.2021 05:50 rigobertogarza2
What is the interquartile range (IQR) of the data set represented by this box
plot?
2
12
30
45
52
0
0
10
20
30
40
50
60
O
A. 52
B. 18
O C. 15
O D. 33
SUBMIT


Answers: 3


Another question on Mathematics

Mathematics, 21.06.2019 12:30
Eric drew a scale drawing of a country park. the scale he used was 1 inch = 2.5 yards. the picnic area is 80 yards wide in real life. how wide is the picnic area in the drawing ?
Answers: 1

Mathematics, 21.06.2019 16:20
Plot the points (0,6), (3,15.8), and (9.5,0) using the graphing tool, and find the function
Answers: 2

Mathematics, 22.06.2019 00:00
Cd is the perpendicular bisector of both xy and st, and cy=20. find xy.
Answers: 1

Mathematics, 22.06.2019 00:00
Abook store is having a 30 perscent off sale. diary of the wimpy kid books are now 6.30 dollars each what was the original price of the books
Answers: 1
You know the right answer?
Questions

Mathematics, 18.10.2019 20:10

English, 18.10.2019 20:10


English, 18.10.2019 20:10

Biology, 18.10.2019 20:10

Mathematics, 18.10.2019 20:10


History, 18.10.2019 20:10

Mathematics, 18.10.2019 20:10

Health, 18.10.2019 20:10


Mathematics, 18.10.2019 20:10


