Mathematics, 10.09.2021 19:10 lavelma2011
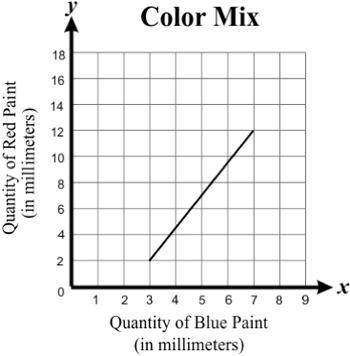
Keira created color panels for a wall using a mix of only red and blue paints. She plotted the quantities of red and blue paints used for each mix and connected them using a line segment, as shown in the graph.
Which statement best describes the domain of the function represented in the graph?
3 ≤ x ≤ 12
3 ≤ x ≤ 7
2 ≤ x ≤ 12
2 ≤ x ≤ 7


Answers: 1


Another question on Mathematics


Mathematics, 21.06.2019 20:00
Last one and the bottom answer choice is y=(x-4)^2+1 you guys!
Answers: 1

Mathematics, 21.06.2019 21:40
Question 1 of 10 2 points different groups of 50 graduates of an engineering school were asked the starting annual salary for their first engineering job after graduation, and the sampling variability was low. if the average salary of one of the groups was $65,000, which of these is least likely to be the average salary of another of the groups? o a. $64,000 o b. $65,000 o c. $67,000 o d. $54,000
Answers: 2

Mathematics, 22.06.2019 02:10
Of jk j(–25, 10) k(5, –20). is y- of l, jk a 7: 3 ? –16 –11 –4 –1
Answers: 1
You know the right answer?
Keira created color panels for a wall using a mix of only red and blue paints. She plotted the quant...
Questions


Mathematics, 29.08.2019 03:00

Mathematics, 29.08.2019 03:00

Geography, 29.08.2019 03:00


Mathematics, 29.08.2019 03:00


Arts, 29.08.2019 03:00

English, 29.08.2019 03:00

Chemistry, 29.08.2019 03:00

History, 29.08.2019 03:00

Mathematics, 29.08.2019 03:00

History, 29.08.2019 03:00

Biology, 29.08.2019 03:00

English, 29.08.2019 03:00

English, 29.08.2019 03:00


