Mathematics, 20.09.2021 14:50 priscillavaladez1112
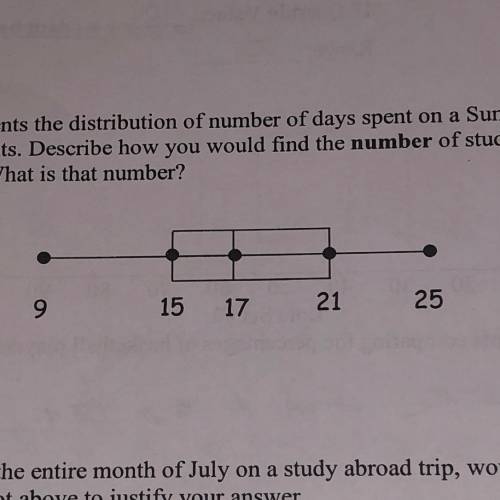
The box plot below represents the distribution of number of days spent on a Summer trip to Study Abroad in
Italy for 200 college students. Describe how you would find the number of students that spent between 17 and
21 days studying abroad. What is that number?


Answers: 3


Another question on Mathematics

Mathematics, 21.06.2019 12:30
Adice is rolled 5 times. how many possible rolls are there? ( determine the number of outcomes using only the fundamental counting principal ) omg bruh can someone me.
Answers: 1


Mathematics, 21.06.2019 18:00
The given dot plot represents the average daily temperatures, in degrees fahrenheit, recorded in a town during the first 15 days of september. if the dot plot is converted to a box plot, the first quartile would be drawn at __ , and the third quartile would be drawn at link to the chart is here
Answers: 1

Mathematics, 21.06.2019 19:30
Evaluate the expression for the given value of the variable. ∣-4b-8∣+∣-1-b^2 ∣+2b^3 ; b=-2
Answers: 2
You know the right answer?
The box plot below represents the distribution of number of days spent on a Summer trip to Study Abr...
Questions

Social Studies, 13.11.2020 19:40

Mathematics, 13.11.2020 19:40

Mathematics, 13.11.2020 19:40


Mathematics, 13.11.2020 19:40

Mathematics, 13.11.2020 19:40

Mathematics, 13.11.2020 19:40

Health, 13.11.2020 19:40

History, 13.11.2020 19:40

Mathematics, 13.11.2020 19:40

Chemistry, 13.11.2020 19:40

Mathematics, 13.11.2020 19:40

History, 13.11.2020 19:40


Biology, 13.11.2020 19:40


History, 13.11.2020 19:40

Mathematics, 13.11.2020 19:40


