Mathematics, 05.11.2021 19:00 fay1016
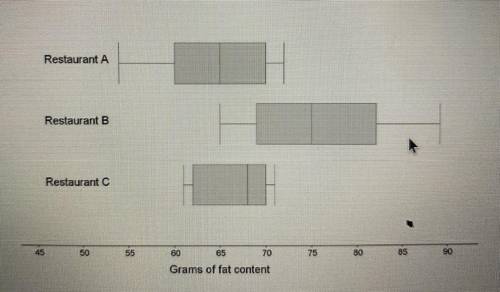
The box plots below represent the grams of fat content in food from 3 restaurants. Which statement below describe the information presented in the box plots? (Multiple answers may be selected)
A. Restaurant B had a greater interquartile range than Restaurant C
B. The median for Restaurant A is greater than the median for Restaurant C
C. The median for restaurant A is the same as the minimum value for Restaurant B
D. Restaurant C has a greater maximum value than Restaurant A
E. Restaurant C has a greater Range the restaurant A.


Answers: 1


Another question on Mathematics

Mathematics, 21.06.2019 17:40
Multiply. write your answer in simplest form. 3/8 x 5/7
Answers: 1

Mathematics, 21.06.2019 19:00
45% of the trees in a park are apple trees. there are 27 apple trees in the park. how many trees are in the park in all?
Answers: 1

Mathematics, 21.06.2019 22:20
Question 9 of 10 2 points suppose your sat score is 1770. you look up the average sat scores for students admitted to your preferred colleges and find the list of scores below. based on your sat score of 1770, which average score below represents the college that would be your best option? o a. 1790 o b. 2130 o c. 2210 od. 1350
Answers: 3

You know the right answer?
The box plots below represent the grams of fat content in food from 3 restaurants. Which statement b...
Questions

Chemistry, 06.12.2019 15:31


Mathematics, 06.12.2019 15:31


English, 06.12.2019 15:31

History, 06.12.2019 15:31

Advanced Placement (AP), 06.12.2019 15:31


Mathematics, 06.12.2019 15:31

History, 06.12.2019 15:31

Mathematics, 06.12.2019 15:31

Biology, 06.12.2019 15:31

Mathematics, 06.12.2019 15:31

Social Studies, 06.12.2019 15:31

Biology, 06.12.2019 15:31

Health, 06.12.2019 15:31

Physics, 06.12.2019 15:31


